
2018 Market Overview
The equity markets peaked on September 20, 2018, when the S&P 500 Index reached 2,930. From that point forward, worries and panic selling set in for the remainder of the year and investors were greeted with extreme volatility and an almost 20% pullback. The selling hit a rapid pace on the trading day of Christmas Eve when some of the equity indexes hit what is considered “bear market” territory. By the end of December, the selling left the equity indexes bruised and battered with the Dow showing losses of 5.63%, the S&P down 6.24% and the Nasdaq off 3.88% for 2018. I’m happy to report however that since the start of 2019, the declines have now been erased as we have seen new optimism and strong buying. As a result, the equity markets have recovered and as of January 18, 2019, the S&P is now up 6.54% since the new year.
Trade wars, midterm elections, and market volatility highlighted 2018 for investors. In an attempt to reduce the trade deficit, President Trump pushed to rewrite trade agreements with several long-time trade partners of the United States. Trump amended the trade agreement with South Korea, imposed tariffs on steel and aluminum, and renegotiated the North American Free Trade Agreement (now called the United States-Mexico-Canada Agreement). But the trade war with China has been the most compelling and impactful, not only to the countries directly involved but to much of the global economy. Reciprocal tariffs were imposed by each economic giant throughout the year. There was a temporary truce achieved following the Group of 20 summit, but there was no definitive agreement reached.
Elections in November showed how politically divided the nation is. Democrats picked up 40 congressional seats to win control of the House of Representatives for the first time since 2011. On the other hand, Republicans maintained control of the Senate. The end result is a Congress that has become more divided, at least politically. Oh, and the federal government shut down in late December due to a budgetary stalemate between President Trump and Congress, principally over funding for a border wall.
For the year, the stock market reached new highs and gave it all back by the end of December. “Volatility” is the word that best describes the market in 2018. Despite the economy expanding at a rate not seen in many years, favorable corporate earnings reports, strong consumer spending, tepid inflation, and plenty of jobs to be had, stocks floundered. Trade wars continued, the Federal Reserve hiked interest rates, oil prices bottomed out, and long-term bond prices rose. The Chicago Board Options Exchange (CBOE) Volatility Index (VIX), which provides a measure of market risk and investors’ sentiments, spiked in February, then was relatively stable through much of the summer. However, by the end of December, the VIX jumped again. Stocks were sold, bought, and sold again in rapid order, causing benchmark indexes to post noteworthy gains and losses on an almost daily basis. As a result, investors rode a roller coaster of stock prices throughout the year.
The year saw some positive highlights as well. The economy expanded at an annual rate exceeding 3.0% for the first time in several years. The unemployment rate hit the lowest mark since 1969. In November, 1.7 million persons were marginally attached to the labor force, an increase of 197,000 from a year earlier. The Federal Reserve, based on the strength of the economy and labor market, raised interest rates four times during the year. Consumer income rose and purchases increased, and inflation exceeded 2.0% midyear, only to fall back below that target by the end of 2018.
The world and the investment landscape has changed a lot over the past 10 years and we believe it is very important for investors to adjust their investment strategies accordingly. What was smart 10 years ago, may not be so smart today! If you have fixed income bond investments, you need to understand how rising interest rates will affect your portfolio. As far as equities, no matter how much is left in the current bull market, it is important for investors to prepare for a potential bear. The right investment strategy that is aligned with YOUR specific needs can make an enormous difference over the long haul.
At PWA, we can help you with a complimentary Risk Analysis Review. We use sophisticated portfolio analytics tools that run stress tests on how a portfolio would have performed under several different economic and market scenarios. The more informed you are about risks and how your investments are positioned, the more you can relax, sleep well, and enjoy the things you love most.
For the year, the stock market reached new highs and gave it all back by the end of December. “Volatility” is the word that best describes the market in 2018.
John L. Diaz, CFP® / President & Senior Wealth Strategist
A Look at the Numbers
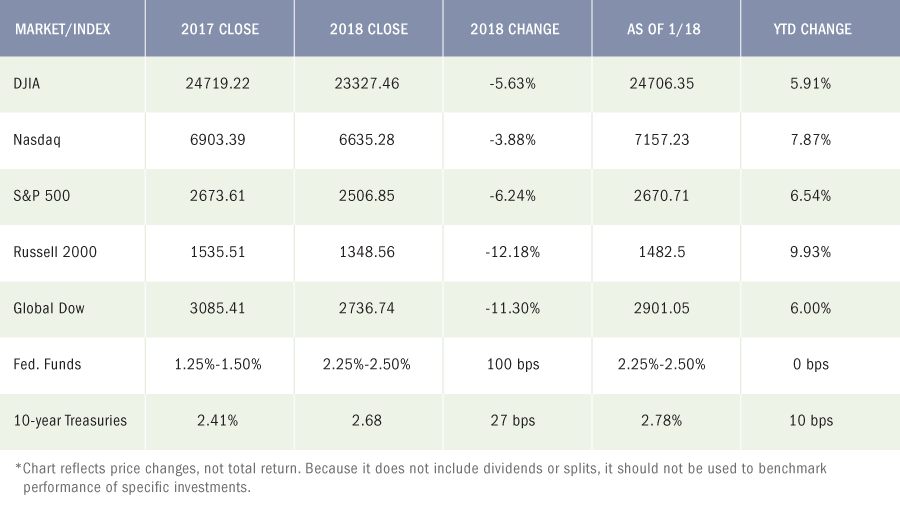
Snapshot 2018 The Markets
Equities
The year 2018 may ultimately mark the end of what was nearly a 10-year bull run. At the start of the year, January was a good month; February and March were not. However, as spring approached, growth in equities began to pick up steam, leading to record highs in several of the benchmark indexes during the summer months. But by October, volatility began to increase, as investor concerns about the impact of a trade war between the world’s largest economies were enough to prompt sell-offs, sending stock prices lower. November was a little better, but December proved to be tumultuous. Ultimately, the benchmark indexes listed here could not match their 2017 year-end values. In fact, several of the benchmark indexes suffered their worst annual losses in many years.
International markets
International equities did not enjoy the same upward momentum in 2018 compared to the prior year. Economic expansion stalled for many international economies as heightened trade tensions between the United States and several of its trade partners and tighter monetary policies cast a shadow over economic expansion. Following demands for more favorable trade terms, the United States imposed tariffs on imports from several of its trade partners. While negotiations ultimately resolved trade wars with some countries, notably Mexico and Canada, a major impasse still exists between the United States and China. The impact on both countries has been palpable, particularly in China, where fixed-asset investment, retail sales, and industrial output have each decreased in 2018 compared to 2017. In Europe, Great Britain is scheduled to leave the European Union soon, yet it remains unclear under what terms Brexit will take place. Also, several countries tightened their respective monetary policies in 2018 on the heels of economic growth in 2017. The lower interest rates in 2017 that helped propel consumer spending and business investment began to rise in 2018, hindering equity and economic expansion.
Bonds
As stock prices soared during the first half of 2018 and interest rates moved incrementally higher, the demand for long-term bonds was marginal. Yields on 10-year Treasuries rose almost 30 basis points in January as bond prices fell. Long-term bond yields continued to climb, reaching 3.0% in July. However, as volatility increased for stocks, the yield on long-term bonds began to fall as demand drove prices higher. Ultimately, the yield on the benchmark 10-year Treasuries closed 2018 at 2.68%, up from the 2017 closing yield of 2.41%.
Oil
Oil prices began 2018 at over $60 per barrel and continued pushing higher through January, reaching almost $70 per barrel in May. Oil prices remained in the $60 range for most of the fall, spiking to almost $76 in early October. But fears of overproduction began pushing oil prices lower in November. Prices continued to fall, hitting a low of nearly $42 per barrel in mid-December. Ultimately, oil prices closed 2018 at $45.81 per barrel — their first annual loss since 2015. As oil prices rose and fell, so did prices at the pump. Retail regular gasoline prices closed the year around $2.321 per gallon on December 24, about $0.151 less than a year ago.
FOMC/interest rates
The Federal Open Market Committee raised interest rates four times during 2018. Each time the target range increased by 25 basis points. The first increase occurred in March, followed by a rate increase in June, an increase in September, and a final bump occurring in December. For the year, the target range has increased 100 basis points, from 1.25%-1.50% to 2.25%-2.50%. Following each rate increase, the Committee expressed the expectation that the labor market would remain strong and the economy would continue to expand, while noting that private business investment had slowed. The Committee changed its stance by the end of the year and reduced its forecasts from four rate increases in 2019 to two 25-basis-point rate increases in 2019.
Currencies
The dollar maintained a relatively strong position throughout much of 2018. The Wall Street Journal Dollar Index, which measures the U.S. dollar against the currencies of 16 other countries, closed 2018 at $89.67, up from its 2017 year-end mark of $85.98. Another currency index, the ICE U.S. Dollar Index, which measures the dollar relative to a basket of six foreign currencies, closed 2018 about 4.5% higher — its best annual gain in several years.
Gold
Through the first quarter of 2018, gold hovered around $1,350 a troy ounce. Rising interest rates, favorable stock market returns, and a strong dollar helped to push gold prices lower during the summer months. However, as stock prices faltered, gold prices pushed closer to their early-year values, finally closing 2018 at $1,284.70.
Outlook for 2019
As of January 18th the S&P 500 is off to its best start in years, up 6.5%, with the Dow industrials not far behind, at 5.9%. While this is not a perfect indicator of what the rest of the year will be like, it does offer a teachable moment for many investors. Primarily, avoid making hasty investment decisions based on market volatility and emotions. Unfortunately, it’s very common that investors that sell or abandon their investment strategies during a market downturn, end up having regrets later as markets very often tend to bounce back quickly. I fully understand why it happens, as it is human nature to be afraid during market selloffs but more often than not, it is best to have an investment strategy and stay the course!
For 2019, we see a frustrating and volatile market environment, but still, no recession! I do believe it would be pretty easy to make both a bullish and a bearish case for the Markets in 2019. For now, we remain in the bullish camp as valuations are now much more favorable and fundamentals remain positive.
Fears of an economic slowdown lingered at the end of last year and we do believe that a slow down may be realized in 2019, but still not enough to go bearish. The housing market hasn’t picked up the pace and is generally lagging behind other economic mainstreams. Also, with inflation inching ahead, the economic stimulus may be easing, which could lead to tighter financial conditions moving ahead. Certainly, if the global trade wars between the United States and China continue, not only will the impact be felt domestically, but a rift between the world’s two largest economies is sure to affect global economies and markets as well.
Normally, the end of January is when we see the government’s first estimate of real GDP growth for the fourth quarter. With the current government shutdown, however, not this year! There seems to be no end in sight and the shutdown has already caused numerous other economic data releases postponed – including figures on retail sales, international trade, inventories, construction, and durable goods – it’s now very unlikely that the GDP report will arrive on time.
Regardless, economists are sifting through plenty of other data that is available and the general consensus is that the economy is not falling off a cliff. In fact, it remains very close to the above-trend growth rate of the past year. Right now, estimates for real GDP growth for the 4th Quarter are at a 2.5% annual rate, which would bring the growth rate for 2018 to 3.1% (comparing the fourth quarter 2018 to the fourth quarter of 2017), that is the fastest pace since 2005.
Geopolitical Issues Remain
Two of the big issues that tormented the equity markets in 2018 remain unresolved, yet the general mood in the markets has improved so much that stocks have been rising, even against a backdrop of news stories that would have prompted heavy selling just a few short months ago.
English Prime Minister Theresa May survived a no-confidence vote in Parliament, but the state of the UK’s plan to leave the European Union remains as uncertain as ever. Despite the risks to Europe’s future economic growth prospects as the stalemate drags on, investors largely seem to be shrugging off the potentially negative consequences.
News of progress in the US-China trade negotiations continues to dribble out, though none of the major issues have been definitively settled so far. During the week, China offered to increase import purchases from the US and the White House floated the possibility of easing tariffs on Chinese goods. The major sticking point going forward is likely to be the protection of the intellectual property rights of American companies doing business in China. Chinese delegates are expected to travel to the US next week to resume negotiations in person.
Federal Budget Showdown
In Washington, little progress was made in the budget battle between President Trump and the Democratic-controlled House of Representatives over funding for a border wall. The resulting shutdown of government agencies will enter the fifth week. An estimated 800,000 employees of government agencies have been affected and many are about to miss a second consecutive paycheck, though the long term economic effects of the standoff are debatable. Rising stock prices despite the shutdown suggest that equity investors have adopted the standpoint that any lost output during the shutdown will be made up upon resolution of the dispute and that the resulting total effect on GDP growth and corporate profitability will be negligible.
The Federal Reserve
Though it’s impossible to identify a single input as the reason for changing investor sentiment, the latest comments from the Federal Reserve and Chairman Jay Powell seem to be largely responsible for the lion’s share of recent optimism. Based on Powell’s assurances that the Fed can now “take their time” with regard to future increases in short term interest rates.
Given the numerous uncertainties that remain, we see continued volatility both up and down. We will be monitoring corporate earnings and forecast closely and keep you abreast of changes in our views. As always, we emphasize the importance of maintaining a diversified investment strategy that is aligned with your specific risk profile, liquidity needs, and investment objectives. Speak with us, we’re here to help.
Data sources: Economic: Based on data from U.S. Bureau of Labor Statistics (unemployment, inflation); U.S. Department of Commerce (GDP, corporate profits, retail sales, housing); S&P/Case-Shiller 20-City Composite Index (home prices); Institute for Supply Management (manufacturing/services). Performance: Based on data reported in WSJ Market Data Center (indexes); U.S. Treasury (Treasury yields); U.S. Energy Information Administration/Bloomberg.com Market Data (oil spot price, WTI Cushing, OK); www.goldprice.org (spot gold/silver); Oanda/FX Street (currency exchange rates). All information is based on sources deemed reliable, but no warranty or guarantee is made as to its accuracy or completeness. Neither the information nor any opinion expressed herein constitutes a solicitation for the purchase or sale of any securities, and should not be relied on as financial advice. Past performance is no guarantee of future results. All investing involves risk, including the potential loss of principal, and there can be no guarantee that any investing strategy will be successful.
The Dow Jones Industrial Average (DJIA) is a price-weighted index composed of 30 widely traded blue-chip U.S. common stocks. The S&P 500 is a market-cap weighted index composed of the common stocks of 500 leading companies in leading industries of the U.S. economy. The NASDAQ Composite Index is a market-value weighted index of all common stocks listed on the NASDAQ stock exchange. The Russell 2000 is a market-cap weighted index composed of 2,000 U.S. small-cap common stocks. The Global Dow is an equally weighted index of 150 widely traded blue-chip common stocks worldwide. Market indices listed are unmanaged and are not available for direct investment.
All third-party materials are the responsibility of their respective authors, creators, and/or owners. First Allied is not responsible for third-party materials, and the information reflects the opinion of its authors, creators, and/or owners at the time of its issuance, which opinions and information are subject to change at any time without notice and without obligation of notification.
These materials were obtained from sources believed to be reliable and presented in good faith, nevertheless, First Allied has not independently verified the information contained therein, and does not guarantee its accuracy or completeness.
The information has no regard to the specific investment objectives, financial situation, or particular needs of any specific recipient, and is intended for informational purposes only and does not constitute a recommendation, or an offer, to buy or sell any securities or related financial instruments, nor is it intended to provide tax, legal or investment advice. We recommend that you procure financial and/or tax advice as to the implications (including tax) of investing in any of the companies mentioned.
PREMIER WEALTH ADVISORS
NEW YORK
1411 Broadway, 16th Floor
New York, NY 10018
(800) 499-4143
LONG ISLAND
626 RXR Plaza, 6th Floor
Uniondale, NY 11856
(516) 778-5822
All content on the Premier Wealth Advisors, LLC. websites are provided for informational purposes only and are deemed to be from reliable sources. However, no warranty, expressed or implied, is made regarding its presentation.
This content should not be viewed as a recommendation, offer, or solicitation by PWA to buy, sell, or hold any security or financial product, nor does it endorse any specific investment strategy. Past performance does not guarantee future results, and all investments carry the potential for loss.
PWA manages portfolios based on each client’s specific investment needs, as specified in a signed investment advisory agreement. As a result, each client’s portfolio reflects unique circumstances and investment outcomes. PWA’s outlook and strategies may change based on updated client information, or if material or significant shifts in economic and financial market conditions occur.
While PWA aims to add value in areas beyond investments, such as tax and estate planning, we do not claim to be income tax professionals or estate planning attorneys. You should consult your tax advisor and/or estate planning attorney for legal or accounting needs.
Advisory Services are offered through Premier Wealth Advisors, LLC. an SEC Registered Investment Adviser.