
2020 Mid-year Perspective
We hope that you, your family, and everyone close to you is healthy and well during these extraordinary times. As we pass six months since the Covid-19 outbreak, it’s safe to say we’ve all been impacted by the pandemic—some have been terribly ill, some have lost loved ones, and all our lives have been enormously disrupted. Given that, it is with a great sense of responsibility and gratitude to our clients, friends, and colleagues that I write this Mid-Year Review and Outlook. Below we will examine the long-term economic implications of our unprecedented circumstances, where we are now, and what could lie ahead.
The Virus and the Economy
The Covid-19 pandemic, and corresponding shutdown, brought virtually all economic activity to a standstill, delivering an enormous blow to the global economy. The containment measures quickly drove the US economy into a recession, effectively ending the longest economic expansion in history*. On June 8, 2020, the National Bureau of Economic Research (NBER), which has official responsibility for determining U.S. business cycles, announced that the US economy entered a recession in February 2020*. This was no great surprise, considering widespread business closures and the resulting spike in unemployment. The final tally for the first quarter of 2020 showed that real gross domestic product (GDP) decreased at an annual rate of 5.0 percent, a significant (but deceptively small) decline because the economy was strong to start the year.
The first read on 2nd Quarter Gross Domestic Product (GDP) came in this morning at a clear all-time historic low, a decline of -32.9%*. That is a scary number but anticipated since this past quarter represented the “shelter in place” measures – everyone knew this would be one for the record books. As bad as that number is, believe it or not, the release was better than expected as consensus estimates were a decline of approximately -35%. To put this into perspective, the largest quarterly drop since World War II was 10% in the first quarter of 1958, followed by 8.4% in the fourth quarter of 2008.* Most economists believe that GDP will turn upward in the third quarter as businesses continue to open.* But given the extreme decline in business activity during the first half of 2020, it will take sustained growth to return the economy to pre-recession levels. In its June economic projections, the Federal Reserve Open Market Committee projected a 6.5% annual drop in GDP for all of 2020, followed by 5.0% growth in 2021 and 3.5% growth in 2022.* The simple math of these projections suggests the economy may not return to early 2019 levels until 2022.
Economic Outlook – The Road to Recovery
The recession caused by the virus is entirely different from a recession-induced by a normal business cycle. Global economic activity was deliberately frozen to stem the pandemic, and while the economic contraction has been severely deep, it also appears to have been very short-lived. The trough appears to have come in May, and we have already seen a rapid rebound in US payrolls. We are also likely to see many more signs of recovery in the weeks and months ahead. Fortunately, the US fiscal policy response has been both robust and timely. In four pieces of legislation, passed in just over two months, Congress approved $2.9 trillion in coronavirus relief, representing about 14 percent of GDP. That is a tremendous amount of liquidity to help cushion the blow and help the economy recover. The question is, will it be enough? While consensus suggests the duration of the actual recession may be brief, it is much too early to know the true strength of the recovery. In our view, the principal question is how the pandemic proceeds, and how successful the country will be in restarting activity while also controlling the spread. As of now, the country is fragmented; some states are slowly restarting, while others are now moving in the opposite direction. Delayed or restricted openings could require a further stimulus. In the near term, we will monitor and constantly assess the durability of the recovery, as any acceleration or deceleration in the number of infections will have a significant impact on economic activity—the markets are paying close attention. Overall, the outlook has become more positive but remains highly uncertain. In the longer term, antibody testing and vaccines will be crucial to enabling the economy to reopen more effectively.
Do you understand the risk in your Portfolio?
At PWA, we can help you with a complimentary Risk Analysis Review. We use sophisticated portfolio analytics to run stress tests on portfolio allocations. We can then provide you with a report on how a portfolio may perform in different economic and market scenarios. The more informed you are about how your investments are positioned, the more you can relax, sleep well, and enjoy the things you love most.
Contact us at 800-499-4143 extension 3 or send an email to info@yourpremierwealth.com with any questions you may have.
The first read on 2nd Quarter Gross Domestic Product (GDP) came in this morning at a clear all-time historic low, a decline of -32.9%.
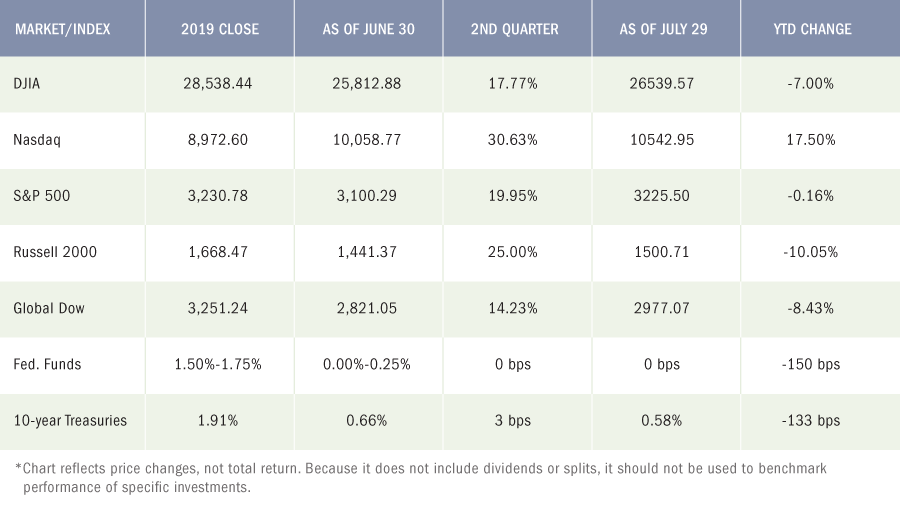
The Markets
The global markets experienced a remarkable second-quarter rebound in both the equity and credit markets. The S&P 500 posted its biggest quarterly gain since 1998, gaining 19.95% and is now approximately 1% below its year-end level*. The U.S. Federal Reserve’s (Fed) decisive and effective actions quickly calmed the liquidity crunch we saw in March, helping to propel averages close to their pre-pandemic levels. However, we believe that much of the second-quarter growth in the stock market and economy is more of a bounce back from a dismal March and April. Nevertheless, stocks rose as investors focused on favorable economic data, the future reopening, and the possibility of further government stimulus.
The biggest risk in our view is a second wave of the virus, which, in addition to the health consequences, could slow down the recovery and trigger a bout of sharp market volatility. While it is still early, we are seeing remarkable signs of resiliency across broad areas of the economy. Manufacturing, housing, and even auto sales have turned upward. Consumers, the engine of the U.S. economy, are spending substantially more than they were in late March and April, thanks to unprecedented government stimulus and central bank liquidity programs. We are closely monitoring second-quarter corporate earnings releases, which are key to better access the outlook, and how quickly revenue and earnings are recovering.
Our concern is that given the strength of the market rebound, are valuations stretched? Have the markets already priced in most of the recovery? Investors may be too optimistic, we shall see.
Key Investment Themes
In our view, healthcare and technology are keys to getting us through the pandemic and into full recovery. The crisis has also highlighted some existing trends that were in place before Covid-19. We have seen a rapid acceleration of digital innovation, and technology companies have responded to our changing circumstances and the challenges posed by the pandemic. Many of us are enjoying the convenience of working from home and the ease with which we can conduct video calls from our kitchens or spare rooms. The digital office has become the norm, and as the months have gone by, it has become more and more embedded in society. And with options for entertainment limited, digital leisure via streaming services and social media, has become even more dominant, along with cloud computing and e-commerce. All of this favors major technology firms. We see opportunities in companies supporting the move to “e-everything”— from learning, finance, gaming, and even healthcare— these trends are likely to continue even after the virus is behind us.
The flipside of this is that the losers from this shift are going to continue to suffer from the trends that were previously apparent. For example, malls, commercial property, and companies that offer traditional forms of leisure like movie theatres and restaurants are not going to recover as quickly as some other areas of the economy. We anticipate that there will many bankruptcies announced in those sectors. However, for the ones that adapt, there will be opportunities to gain market share in all these challenged sectors.
For our equity, as well as fixed-income models, our focus remains on quality! We look to emphasize securities of companies with strong, sustainable market positions, predictable cash flows, good management, and healthy balance sheets. We believe these traits will continue to be highly valued by investors – particularly given the more difficult economic backdrop ahead.
However, given the extent of the recent recovery in many of the sectors discussed above, valuations may now be stretched. Corporate earnings and economic data will be key, as we would like to see fundamentals be more in line with current valuations. With the numerous uncertainties ahead, we are bound to see negative headlines and an increase in volatility. We recommend a gradual approach to put new money to work. We are here to help.
* National Bureau of Economic Research, June 2020
* U.S. Bureau of Economic Analysis, June 2020
* Federal Reserve Bank of Atlanta, July 9, 2020
* The Wall Street Journal Economic Forecasting Survey, July 2020
IRS Clarifies COVID-19 Relief Measures for Retirement Savers
The Coronavirus Aid, Relief, and Economic Security (CARES) Act passed in March 2020 ushered in several measures designed to help IRA and retirement plan account holders cope with the financial fallout from the virus. The rules were a welcome relief to many people but left questions about the details unanswered. In late June, the IRS released Notices 2020-50 and 2020-51, which shed light on these outstanding issues.
Required minimum distributions (RMDs)
One CARES Act measure suspends 2020 RMDs from defined contribution plans and IRAs. Account-holders who prefer to forgo RMDs from their accounts, or to withdraw a lower amount than required, may do so. The waiver also applies to account holders who turned 70½ in 2019 and would have had to take their first RMD by April 1, 2020, as well as beneficiaries of inherited retirement accounts.
One of the questions left unanswered by the legislation was: “What if an account holder took an RMD in 2020 before the passage of the CARES Act and missed the 60-day window to roll the money back into a qualified account?”
In April, IRS Notice 2020-23 extended the 60-day rollover rule for those who took a distribution on or after February 1, 2020, allowing participants to roll their money back into an eligible retirement account by July 15, 2020. This seemingly left account owners who had taken RMDs in January without recourse. However, IRS Notice 2020-51 rectified the situation by stating that all 2020 RMDs — even those received as early as January 1 — may be rolled back into a qualified account by August 31, 2020. Moreover, such a rollover would not be subject to the one-rollover-per-year rule.
This ability to undo a 2020 RMD also applies to beneficiaries who would otherwise be ineligible to conduct a rollover. (However, in their case, the money must be rolled back into the original account.)
This provision does not apply to defined benefit plans.
Coronavirus withdrawals and loans
Another measure in the CARES Act allows qualified IRA and retirement plan account holders affected by the virus to withdraw up to $100,000 of their vested balance without having to pay the 10% early-withdrawal penalty (25% for certain SIMPLE IRAs). They may choose to spread the income from these “coronavirus-related distributions,” or CRDs, ratably over a period of three years to help manage the associated income tax liability. They may also recontribute any portion of the distribution that would otherwise be eligible for a tax-free rollover to an eligible retirement plan over a three-year period, and the amounts repaid would be treated as a trustee-to-trustee transfer, avoiding tax consequences.1
In addition, the CARES Act included a provision stating that between March 27 and September 22, 2020, qualified coronavirus-affected retirement plan participants may also be able to borrow up to 100% of their vested account balance or $100,000, whichever is less. In addition, any qualified participant with an outstanding loan who has payments due between March 27, 2020, and December 31, 2020, may be able to delay those payments by one year.
IRS Notice 2020-50
To be eligible for coronavirus-related provisions in the CARES Act, “qualified individuals” were originally defined as IRA owners and retirement plan participants who were diagnosed with the virus, those whose spouses or dependents were diagnosed with the illness, and account holders who experienced certain adverse financial consequences as a result of the pandemic. IRS Notice 2020-50 expanded that definition to also include an account holder, spouse, or household member who has experienced pandemic-related financial setbacks as a result of:
- A quarantine, furlough, layoff, or reduced work hours
- An inability to work due to lack of childcare
- Owning a business forced to close or reduce hours
- Reduced pay, or self-employment income
- A rescinded job offer or delayed start date for a job
These expanded eligibility provisions enhance the opportunities for account holders to take a CRD.
The Notice clarifies that qualified individuals can take multiple distributions totaling no more than $100,000 regardless of actual need. In other words, the total amount withdrawn does not need to match the amount of adverse financial consequences. (Retirement investors should consider the pros and cons carefully before withdrawing money.)
It also states that individuals will report a coronavirus-related distribution (or distributions) on their federal income tax returns and on Form 8915-E, Qualified 2020 Disaster Retirement Plan Distributions and Repayments. Individuals can also use this form to report any re-contributed amounts. As noted above, individuals can choose to either spread the income ratably over three years or report it all in year one; however, once a decision is indicated on the initial tax filing, it cannot be changed. Note that if multiple CRDs occur in 2020, they must all be treated consistently — either ratably over three years or reported all at once.
Taxpayers who recontribute amounts after paying taxes on reported CRD income will have to file amended returns and Form 8915-E to recoup the payments. Taxpayers who elect to report income over three years and then re-contribute amounts that exceed the amount required to be reported in any given year may “carry forward” the excess contributions — i.e., they may report the additional amounts on the next year’s tax return.
The Notice also clarifies that amounts can be re-contributed at any point during the three-year period beginning the day after the day of a CRD. Amounts re-contributed will not apply to the one-rollover-per-year rule.
Regarding plan loans, participants who delay their payments as permitted by the CARES Act should understand that once the delay period ends, their loan payments will be recalculated to include interest that accrued over the time frame and re-amortized over a period up to one year longer than the original term of the loan. Retirement plans are not required to adopt the loan and withdrawal provisions, so check with your plan administrator to see which options might apply to you. However, qualified individuals whose plans do not specifically adopt the CARES Act provisions may choose to categorize certain other types of distributions — including distributions that in any other year would be considered RMDs — as CRDs on their tax returns, provided the total amount does not exceed $100,000.
For more information, review IRS Notices 2020-50 and 2020-51, and speak with a tax professional.
1Qualified beneficiaries may also treat the distribution as a CRD; however, non-spousal beneficiaries are not permitted to recontribute funds, as they would not otherwise be eligible for a rollover.
Latest Economic News
Employment
For the week ended July 18, there were 1,416,000 claims for unemployment insurance, an increase of 109,000 from the previous week’s level, which was revised up by 7,000. According to the Department of Labor, the advance rate for insured unemployment claims was 11.1% for the week ended July 11, a decrease of 0.7 percentage point from the prior week’s revised rate. The advance number of those receiving unemployment insurance benefits during the week ended July 11 was 16,197,000, a decrease of 1,107,000 from the prior week’s level, which was revised down by 34,000.
Employment rose by a stunning 2.5 million in May after falling 20.6 million in April. Notable job gains occurred in leisure and hospitality, construction, education and health services, and retail trade. The unemployment rate dropped 1.4 percentage points to 13.3% for the month as the number of unemployed persons dropped by close to 2.1 million to 21.0 million. Improvements in the labor market reflected a limited resumption of economic activity that had been curtailed in March and April due to the COVID-19 pandemic and efforts to contain it. While these numbers are better, put in perspective, the unemployment rate and number of unemployed persons are up 9.8 percentage points and 15.2 million, respectively, since February. In May, average hourly earnings fell by $0.29 to $29.75, primarily due to job gains among lower-paid workers. Average hourly earnings increased by 6.7% over the last 12 months ended in May. The average workweek rose by 0.5 hours to 34.7 hours in May. The labor participation rate for May was 60.8% (60.2% in April). The employment-population ratio was 52.8% last month, 1.5 percentage points ahead of April’s figure.
Claims for unemployment insurance reached historic levels in May, spiking to more than 25.0 million. The rate for insured unemployment claims also reached a historic high of 17.2%. Since the initial impact of the virus in mid-March, nearly 47.5 million initial claims for unemployment benefits have been filed. For the week ended June 13, the number of those receiving unemployment insurance benefits decreased to 19.522, and the rate for insured unemployment claims fell to 13.4%.
FOMC / interest rates
The Federal Open Market Committee held its regularly scheduled meeting in early June and unanimously voted to hold the target range for the federal funds rate at its current 0.00%-0.25%. According to the Committee, the ongoing public health crisis caused by the COVID-19 pandemic will weigh heavily on economic activity, employment, and inflation in the near term, while posing considerable risks to the economic outlook over the medium term. The FOMC expects to maintain this rate until it is confident the economy has weathered the recent events, which according to its projections, will run through the year 2022. In addition, the Fed announced that it will be increasing, at least at the current pace, holdings of Treasuries and residential and commercial mortgage-backed securities.
GDP / budget
According to the third and final estimate for the first-quarter gross domestic product, the economy decelerated at an annualized rate of 5.0%. Consumer spending was a big drag, falling 6.8%, reeling from the initial effects of the COVID-19 pandemic. Fixed investment fell 1.3% in the first quarter (-0.6% in the fourth quarter), and nonresidential fixed investment dropped 6.4% in the first quarter, compared to a 2.4% decline in the prior quarter. Net exports were down 9.0%, and imports sank 15.7%. Consumer prices advanced at a rate of 1.3% in the first quarter, compared to the fourth quarter (1.4%).
The Treasury budget deficit came in smaller than expected in May. Nevertheless, the deficit, at $398.8 billion, was nearly twice as high as the deficit for May 2019. Through the first eight months of fiscal 2020, the deficit is $1.880 trillion, nearly 91.0% greater than the deficit over the same period in fiscal 2019. So far this fiscal year, outlays are 29.4% above the 2019 figure, while receipts are 11.2% lower.
Inflation / Consumer Spending
- According to the Personal Income and Outlays report for May (released June 26), personal income and disposable (after-tax) personal income fell 4.2% and 4.9%, respectively. This followed April increases of 10.8% (personal income) and 13.1% (disposable personal income). The decrease in personal income last month is largely attributable to a reduction in federal government payments from recovery programs initiated due to the pandemic. Consumers ramped up their spending in May, as personal consumption expenditures increased 8.2%, after falling 12.6% in April. Inflation remains muted as prices for consumer goods and services rose a scant 0.1% in May after falling 0.5% the previous month. For the past 12 months, consumer prices are up a mere 0.5%.
- Deflation is trending at the consumer level. The Consumer Price Index slid 0.1% in May, marking the third consecutive monthly decrease, which hasn’t happened in the 63-year history of this index. Year to date, consumer prices are up 0.1%. Excluding food and energy, prices also fell by 0.1% last month. Energy prices dropped 1.8% in May for the fifth straight monthly decline. Transportation services are down 3.6%, and airfares plunged 4.9% in May after cascading 15.2% and 12.6% in April and March, respectively. On the other hand, consumer prices for food edged up 0.7% and medical care services rose 0.6% in May.
- Prices producers receive for goods and services rebounded from a dismal April, climbing 0.4% in May. Year to date, producer prices are down 0.8%, however. In May, energy prices climbed 4.5% after falling 19.0% in April and 6.7% in March. Food prices shot up by 6.0% last month, although trade services fell by 0.8%.
Housing
Sales of existing homes rebounded in June following declines in March, April, and May. According to the latest report from the National Association of Realtors®, total home sales jumped 20.7% last month from May. However, existing-home sales are 11.3% below their pace of a year ago. The median existing-home price for all housing types in June was $295,300 ($284,600 in May), up 3.5% from June 2019. Total inventory is up 1.3% in June and sits at a four-month supply. Sales of existing single-family homes also surged in June, climbing 19.9% from May. Single-family home sales are down 9.9% from a year ago. The median existing single-family home price was $298,600 in June, up 3.5% from June 2019.
New single-family home sales also surged in June, climbing 13.8% above May’s totals. Sales of new single-family homes are 6.9% above the June 2019 estimate. The median sales price of new houses sold in June 2020 was $329,200. The average sales price was $384,700. Inventory of new single-family homes for sale in June was 307,000, representing a 4.7-month supply at the current sales rate.
For the week ended July 18, there were 1,416,000 claims for unemployment insurance, an increase of 109,000 from the previous week’s level, which was revised up by 7,000. According to the Department of Labor, the advance rate for insured unemployment claims was 11.1% for the week ended July 11, a decrease of 0.7 percentage point from the prior week’s revised rate. The advance number of those receiving unemployment insurance benefits during the week ended July 11 was 16,197,000, a decrease of 1,107,000 from the prior week’s level, which was revised down by 34,000.
Manufacturing
Following April’s dismal report, industrial production increased 1.4% in May. Manufacturing, which had fallen 15.5% the prior month, pushed ahead 3.8% in May. However, total industrial production in May was 15.4% below its pre-pandemic level in February. Compared to May 2019, industrial production is down 15.3%, while manufacturing is off by 16.5% over the same 12-month period. Mining and utilities fell 6.8% and 2.3%, respectively, in May.
New orders for durable goods followed April’s 18.1% decline by advancing 15.8% in May. Transportation equipment drove the increase, surging ahead by 80.7% last month. However, excluding transportation, new orders increased 4.0%. For the year, new orders for durable goods have fallen 13.6%. New orders for nondefense capital goods (manufactured assets used by businesses to produce consumer goods) jumped ahead 27.1% in May, also driven primarily by a jump in transportation.
Imports and exports
May saw energy prices swing higher, driving import prices up 1.0% after falling 2.6% in April. Imported crude oil prices advanced 31.7% last month after dropping 36.9% in April. Excluding fuel, import prices ticked up 0.1% in May. Since May 2019, import prices have declined 6.0%. The price index for U.S. exports rose 0.5% in May following a 3.3% drop the previous month.
The international trade in goods deficit was $74.3 billion in May, up $3.6 billion from April. Exports of goods for May were $90.1 billion, $5.5 billion less than April exports. Imports of goods for May were $164.4 billion, $1.9 billion less than April imports.
The latest information on international trade in goods and services, out June 4, is for April and shows that the goods and services trade deficit increased by $7.1 billion, or 16.7%. April exports were $38.9 billion, or 20.5%, less than March exports. April imports were $31.8 billion, or 13.7%, less than March imports. Year to date, the goods and services deficit sits at $168.5 billion, a decrease of $26.0 billion, or 13.4%, from the same period in 2019.
International markets
Global markets rebounded in the second quarter on the heels of fiscal stimulus, easing of restrictions, and interest rates at 0% and below. By the end of March, world stocks had lost about 35.0% from their year-end highs. By the end of June, these same markets are within 10.0% of February’s record highs. A spike in new virus cases could send world markets reeling again. While inflation remains muted in the United States, prices are slowly escalating in Europe, where longer-range forecasts see inflation rising to 1.0% — close to its highest level since early March. In Asia, the Nikkei 225 is up about 2.0% for the month, the Shanghai Composite Index has gained 2.2% for the month, and the Hang Seng Index has climbed nearly 5.0%.
Consumer confidence
The Conference Board Consumer Confidence Index® was little changed in May, coming in at 86.6, slightly above April’s 85.7 reading. The Present Situation Index — based on consumers’ assessment of current business and labor market conditions — decreased from 73.0 to 71.1. However, the Expectations Index, which is based on consumers’ short-term outlook for income, business, and labor market conditions, improved from 94.3 in April to 96.9 last month.
The Dow Jones Industrial Average (DJIA) is a price-weighted index composed of 30 widely traded blue-chip U.S. common stocks. The S&P 500 is a market-cap weighted index composed of the common stocks of 500 leading companies in leading industries of the U.S. economy. The NASDAQ Composite Index is a market-value weighted index of all common stocks listed on the NASDAQ stock exchange. The Russell 2000 is a market-cap weighted index composed of 2,000 U.S. small-cap common stocks. The Global Dow is an equally weighted index of 150 widely traded blue-chip common stocks worldwide. Market indices listed are unmanaged and are not available for direct investment.
All third-party materials are the responsibility of their respective authors, creators, and/or owners. First Allied is not responsible for third-party materials, and the information reflects the opinion of its authors, creators, and/or owners at the time of its issuance, which opinions and information are subject to change at any time without notice and without obligation of notification.
These materials were obtained from sources believed to be reliable and presented in good faith, nevertheless, First Allied has not independently verified the information contained therein, and does not guarantee its accuracy or completeness.
The information has no regard to the specific investment objectives, financial situation, or particular needs of any specific recipient, and is intended for informational purposes only and does not constitute a recommendation, or an offer, to buy or sell any securities or related financial instruments, nor is it intended to provide tax, legal or investment advice. We recommend that you procure financial and/or tax advice as to the implications (including tax) of investing in any of the companies mentioned.
PREMIER WEALTH ADVISORS
NEW YORK
1411 Broadway, 16th Floor
New York, NY 10018
(800) 499-4143
LONG ISLAND
626 RXR Plaza, 6th Floor
Uniondale, NY 11856
(516) 778-5822
All content on the Premier Wealth Advisors, LLC. websites are provided for informational purposes only and are deemed to be from reliable sources. However, no warranty, expressed or implied, is made regarding its presentation.
This content should not be viewed as a recommendation, offer, or solicitation by PWA to buy, sell, or hold any security or financial product, nor does it endorse any specific investment strategy. Past performance does not guarantee future results, and all investments carry the potential for loss.
PWA manages portfolios based on each client’s specific investment needs, as specified in a signed investment advisory agreement. As a result, each client’s portfolio reflects unique circumstances and investment outcomes. PWA’s outlook and strategies may change based on updated client information, or if material or significant shifts in economic and financial market conditions occur.
While PWA aims to add value in areas beyond investments, such as tax and estate planning, we do not claim to be income tax professionals or estate planning attorneys. You should consult your tax advisor and/or estate planning attorney for legal or accounting needs.
Advisory Services are offered through Premier Wealth Advisors, LLC. an SEC Registered Investment Adviser.