
2021 Market Review & ’22 Outlook
We hope that you, your family, and everyone close to you are healthy and well.
After closing out a very nice year for investors, the markets are off to a rocky start as a new era of tighter monetary policy and higher interest rates hit investors hard this week. Previous expectations were that Federal Reserve tightening would be “limited and gradual” but apparently, that will not be the case. The FOMC (Federal Open Market Committee) minutes released on Wednesday (Jan 5, 2022) showed that officials were fully on board with a faster reduction of the central bank’s asset purchase program known as “Quantitative Easing” (QE). This new revelation gives them greater flexibility to raise interest rates and it is now projected that it could happen as soon as March. As a result, investors sold high-growth stocks that were great performers in 2021. The Nasdaq ended the day down more than 3%, marking the worst start to a calendar year since the financial crisis of 2008 (SOURCE: Wall St Journal).
It’s good to note that the first couple of weeks of a new trading year always seems to be volatile and with very little direction. This is primarily caused by fund managers, institutions, hedge funds, etc. readjusting their portfolios for the new year. In the near term, we believe the volatility will likely continue and it wouldn’t be surprising if we saw a deeper market correction of at least 10% at some point this year. Periodic market corrections are normal and healthy market activity. Given the extent of the equity market advance of more than 50% over the past 3 years, a correction would be understandable.
At PWA, we remain bullish for equity markets in 2022 but anticipate it will be a more difficult and bumpier ride. In this evolving economic climate, we are adjusting portfolios for the end of easy money and supportive monetary policies, allocating to the sectors, industries, and investment factors that we believe will outperform in 2022, while monitoring potential challenges that could impede the continued broad market rally.
At PWA, we remain bullish for equity markets in 2022 but anticipate it will be a difficult and bumpy ride.
John L. Diaz, CFP® / President & Senior Wealth Strategist
2021 Market Review
The year 2021 was one of extreme change. January saw the inauguration of President Joe Biden, but not before protesters sieged the United States Capitol. Despite the initial tumult, the year began with hope that increased availability of coronavirus vaccinations would lead to the end of the pandemic. Unfortunately, throughout the year, the emergence of virus mutations, coupled with the uneven distribution of vaccines, saw millions more people become ill or perish after contracting the virus.
Nevertheless, several of the worlds’ largest economies enjoyed notable recoveries. In the United States, two additional rounds of stimulus payments in the first quarter helped line consumers’ pocketbooks, which led to rapidly increasing demand for goods and services. Historically low lending rates and a rise in remote work increased the opportunity for consumers to spend.
However, the rapid economic turnaround brought with it a historic surge in consumer and producer prices, labor shortages, and global supply-chain bottlenecks. Low-interest rates and stimulus measures adopted by the Federal Reserve gave people more access to money and buying power. Personal income increased as did personal consumption expenditures. Corporate earnings were strong, despite labor and supply shortages and lingering economic uncertainty caused by the pandemic.
U.S. inflation reached a nearly 40-year high late in the year, as growing consumer demand was stunted by pandemic-related supply constraints. Historically low mortgage rates helped propel the housing market, as both the number of residential sales and property values escalated. Energy prices, particularly gas prices, rose by nearly 50%, as crude oil reached more than $80 per barrel for the first time since 2014.
An influx of day-trading investors collided with hedge-fund investors and Wall Street professionals. So-called “meme traders” manipulated stock prices from their sofas through collaborative investing on social media platforms.
Cryptocurrency also gained more mainstream acceptance and attention in 2021, with a market cap of all cryptocurrencies topping $3 trillion. The rapid growth of cryptocurrency also led to more government scrutiny. China’s central bank declared all cryptocurrency-related transactions illegal as that country was determined to crack down on the industry.
U.S. economic recovery was highlighted by job growth and dwindling unemployment claims. Employment gains averaged over 550,000 per month in 2021, while weekly jobless claims fell to a 52-year low in December.
Despite increasing numbers of COVID-related cases, the stock market generally prospered, with each of the benchmark indexes posting year-over-year gains. Each of the market sectors also ended 2021 in the black.
Overall, we experienced plenty of change in 2021. The year 2022 is likely to be very interesting as well.
Do you understand the risk in your Portfolio?
At PWA, we can help you with a complimentary Risk Analysis Review. We use sophisticated portfolio analytics to run stress tests on portfolio allocations. We can then provide you with a report on how a portfolio may perform in different economic and market scenarios. The more informed you are about how your investments are positioned, the more you can relax, sleep well, and enjoy the things you love most.
Contact us at 800-499-4143 extension 3 or send an email to info@yourpremierwealth.com with any questions you may have.
2021 Markets Snapshot
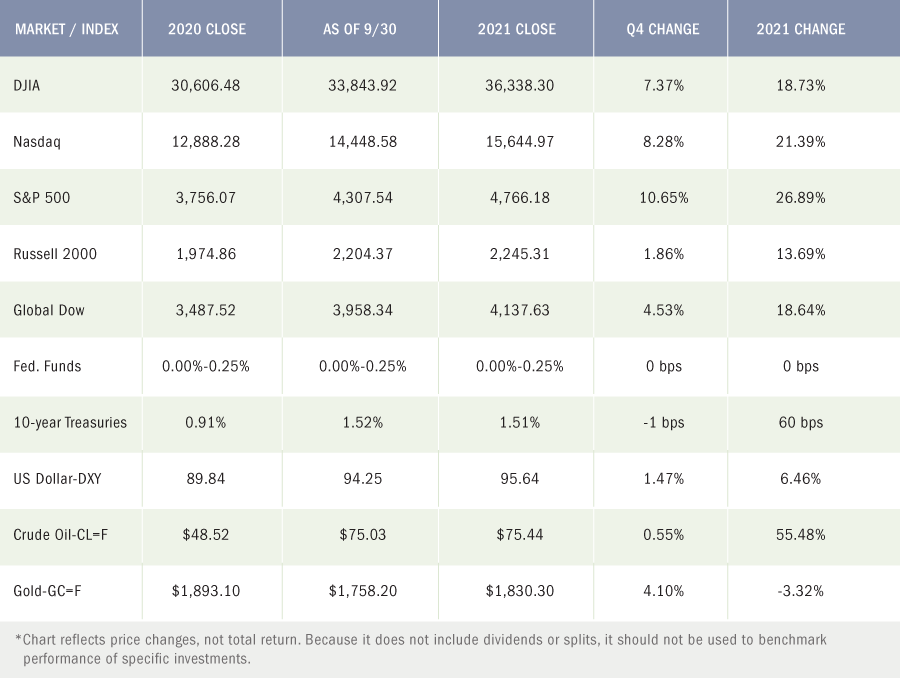
Equities: Throughout the year, the U.S. stock market pushed higher. Despite mounting COVID cases, escalating inflation, labor shortages, supply bottlenecks, and severe weather that hit nearly every part of the country at one time or another, Wall Street continued to post gains. Large caps, small caps, growth, value — seemingly every market segment increased, surpassing most of the outlooks at the start of the year. While many factors contributed to the strong market performance in 2021, a few highlights include consistently favorable data pointing to ongoing economic recovery, strong corporate earnings throughout 2021, the acceptance of cryptocurrency as a mainstream investment, a low interest-rate environment, stimulus programs that provided consumers with cash, increasing job opportunities, and the availability of coronavirus vaccines. On the last day of the year, the S&P 500 eclipsed its 2020 closing by nearly 27.0%, the Nasdaq rose by more than 21.3%, the Dow gained about 19.0%, the Global Dow advanced 18.6%, and the Russell 2000 climbed 13.7%. The fourth quarter was particularly robust for large caps, with the S&P 500 climbing 10.7% and the Dow advancing 7.4%. Each of the market sectors closed the year well above its prior year’s totals. Energy ended 2021 48.0% higher, followed by real estate (43.0%), information technology (33.5%), and financials (33.0%).
Bonds: For the most part, long-term bonds underperformed, particularly on inflation concerns, low-interest rates, economic growth, and favorable stock performance. Ten-year Treasuries ended the year at 1.51%, up 60 basis points, the biggest annual rise since 2013. U.S. bond returns were down about 3.0%, well below other major bond markets. With the Federal Reserve likely to accelerate interest rates in 2022, 10-year Treasury yields are expected to push above 2.0% next year.
Oil: Crude oil prices fell in 2020 as demand dwindled due to coronavirus constraints. However, crude oil prices surged in 2021 as economic growth quickly increased demand and the time needed to accelerate output to pre-pandemic levels. Crude oil prices opened the year around $48.50 per barrel but rose steadily for most of the year, reaching more than $80.00 per barrel in October — a price not seen since 2014 — ultimately ending 2021 at about $75.44 per barrel.
Prices at the pump also vaulted higher in 2021. The national average retail price for regular gasoline was $2.249 per gallon to begin 2021. Gas prices steadily increased throughout the year, reaching a high of $3.410 in early November. Gas prices trended marginally lower for the remainder of 2021, closing out the year at $3.275 per gallon on December 27.
FOMC/interest rates: The Federal Reserve began the year focused on promoting economic recovery. The Fed maintained the target range for the federal funds rate at 0.00%-0.25% for the duration of 2021, while continuing to purchase securities on a monthly basis ($80 billion Treasuries and $40 billion mortgage-backed securities) through November. For much of the year, employment gains were solid, consumer demand for goods and services increased, and overall economic activity strengthened. However, strong consumer demand collided with pandemic-related supply constraints, driving prices higher, such that inflation hit a nearly 39-year high in November, with prices up 6.8% (Consumer Price Index) from a year before. The Fed initially termed the rapid rise in prices “transitory,” expecting that the factors driving inflation upward would subside. However, by November, the Fed acknowledged that factors contributing to inflationary pressures were more than “transitory” and agreed to begin tapering its asset purchases in December. The Fed also projected that it would increase interest rates as many as three times in 2022.
US Dollar-DXY: The dollar held its own for much of the year, reaching a new high in November. Despite a marginal dip at the end of the year, the dollar is still on track to enjoy its biggest gain since 2015. With the prospects of the Federal Reserve raising interest rates, the dollar could see another surge in 2022. The US Dollar Index (DX-Y.NYB), which measures the U.S. dollar against the currencies of several other countries, hit a high of $96.94 in November and hovered between $92.60 and $96.00 since early July. It closed at $95.64 on December 31, rising nearly 6.5% since the beginning of the year.
Gold: Gold prices began the year at $1,893.10 and closed in 2021 at $1,830.30, a decrease of nearly 3.3%. During the year, gold fell to $1,700.20 at the end of February, only to surge to $1,895.70 in mid-May. Generally, stock market growth, rising bond yields, and a stronger dollar kept gold prices in check for most of 2021.
Latest Economic News
Employment
Job growth slowed in November with the addition of 210,000 new jobs, well below the 2021 monthly average of 555,000. The unemployment rate fell by 0.4 percentage points to 4.2%. The number of unemployed persons fell by 542,000 to 6.9 million. For comparison, in November 2020 the unemployment rate was 6.7% and the number of unemployed persons was 10.7 million. While both measures are down considerably from their highs at the end of the February-April 2020 recession, they remain above their levels prior to the coronavirus pandemic (3.5% and 5.7 million, respectively, in February 2020). Among the unemployed, the number of workers who permanently lost their jobs declined by 205,000 to 1.9 million in November, although this is 623,000 higher than in February 2020. The labor force participation rate edged up to 61.8% in November and is 1.5 percentage points lower than in February 2020. The employment-population ratio increased by 0.4 percentage points to 59.2% in November but remained below the pre-pandemic figure of 61.1% in February 2020. In November, average hourly earnings increased by $0.08 to $31.03. Over the past 12 months ended in November, average hourly earnings rose by 4.8% (average hourly earnings in November 2020 were $29.61). The average workweek increased by 0.1 hours to 34.8 hours in November (unchanged from November 2020).
There were 965,000 Initial claims for unemployment insurance for the week ended January 9, 2021. During the same period, the total number of workers receiving unemployment insurance was 5,271,000. Over the course of the year, initial weekly claims steadily decreased on a monthly basis thereafter, hitting a low of 188,000 in early December. As of December 25, there were 198,000 initial claims for unemployment insurance and the total number of claims paid for the week ended December 18 was 1,716,000, which is below the February 2020 (pre-pandemic) figure of 1,724,000.
FOMC / interest rates
The Federal Open Market Committee met in December and agreed to cut its asset purchase program by $30 billion per month beginning in January 2022, with the option of making similar reductions in the pace of asset purchases each month thereafter, unless the Committee determines an adjustment is warranted. The Committee decided to keep the target range for the federal funds rate at 0.00%-0.25%. The FOMC acknowledged that inflation is broad-based and attributed it to “supply and demand imbalances related to the pandemic and the reopening of the economy.”
GDP / budget
While the economy accelerated in the third quarter, it did not keep pace with the rate of growth in the second quarter. Gross domestic product increased at an annualized rate of 2.3% in the third quarter. GDP rose 6.7% in the second quarter. The increase in third-quarter GDP reflected the continued economic impact of the COVID-19 pandemic. A resurgence of COVID-19 cases resulted in new restrictions and delays in the reopening of establishments in some parts of the country. Government assistance payments in the form of forgivable loans to businesses, grants to state and local governments, and social benefits to households all decreased. Consumer spending, as measured by the personal consumption expenditures index, rose 2.3% in the third quarter, well below the pace set in the second quarter (6.7%) and the first quarter (6.3%). Nonresidential (business) fixed investment rose 1.7% in the third quarter compared to a 9.2% jump in the second quarter. Exports fell 5.3% in the third quarter, compared with a 7.6% increase in the previous quarter. Imports, which are negative in the calculation of GDP, rose 4.7% in the third quarter, down from a 7.1% increase in the second quarter. Consumer prices increased 5.3% in the third quarter (6.5% in the second quarter). Excluding food and energy, consumer prices advanced 4.6% in the third quarter (6.1% in the second quarter).
November saw the federal budget deficit come in at $191.3 billion, down roughly 32.0% from November 2020. The deficit for the first two months of the fiscal year 2022, at $356.4 billion, is 20.5% lower than the first two months of the previous fiscal year. Through November, government outlays rose 4.0%, while receipts increased 21.6%. Through the first two months of the fiscal year 2022 compared to the same period last year, individual income taxes are up to $79.6 billion ($282.1 billion versus $202.5 billion), while corporate income taxes have risen $9.4 billion ($15.4 billion versus $6.0 billion).
Inflation / Consumer Spending
- According to the latest Personal Income and Outlays report, personal income and disposable personal income rose 0.4% in November after increasing 0.5% and 0.4%, respectively, in October. Consumer spending advanced 0.4% in November after increasing 1.4% the previous month. Consumer prices climbed 0.6% in November after increasing 0.7% in October. Consumer prices have risen 5.7% since November 2020.
- The Consumer Price Index climbed 0.8% in November after advancing 0.9% in October. Over the 12 months ended in November, the CPI rose 6.8% — the largest 12-month gain since June 1982. Price growth was broad-based, with all major categories showing an increase, led by gasoline (6.1%), energy commodities (5.9%), fuel oil (3.5%), and used cars and trucks (2.5%). Prices for food rose 0.7%, while prices for food at home increased 0.8%. Since November 2020, gasoline prices are up 58.1%, fuel oil has increased 59.3%, food prices have risen 6.1% (food at home has climbed 6.4%), while new vehicles (11.1%) and used vehicles (31.4%) also advanced.
- Prices that producers receive for goods and services rose 0.8% in November following a 0.6% October jump. Producer prices increased 9.6% for the 12 months ended in November, the largest advance since data was first calculated in November 2010. Producer prices for fewer foods, energy, and trade services rose 0.7% in November, which is the largest monthly increase since July 2021. In November, prices for services increased 0.7%, while prices for goods climbed 1.2%. For the 12 months ended in November, prices of fewer foods, energy, and trade services moved up 6.9%, the largest rise since 12-month data was first calculated in August 2014.
Housing
Sales of existing homes increased 1.9% in November, marking the third consecutive monthly increase. Existing home sales dropped 2.0% from November 2020. The median existing-home price was $353,900 in November, the same price as in October. Unsold inventory of existing homes represents a 2.1-month supply at the current sales pace, a decline from both the prior month and from one year ago. Sales of existing single-family homes rose 1.6% in November following a 1.3% jump in October. Over the last 12 months, sales of existing single-family homes are down 2.2%. The median existing single-family home price was $362,600 in November, up from $360,800 in October.
New single-family home sales also advanced in November, climbing 12.4% after falling 9.2% (revised) in October. The median sales price of new single-family houses sold in November was $416,900 ($408,700 in October). The November average sales price was $481,700 ($478,200 in October). The inventory of new single-family homes for sale in November represented a supply of 6.5 months at the current sales pace, down from the October estimate of 7.1 months.
Consumer confidence
The Conference Board Consumer Confidence Index® increased in December. The index stands at 115.8, up from 111.9 in November (revised). The Present Situation Index, based on consumers’ assessment of current business and labor market conditions, was relatively flat at 144.1 in December, down from 144.4 the previous month. The Expectations Index — based on consumers’ short-term outlook for income, business, and labor market conditions — increased to 96.9 in December, up from November’s reading of 90.2.
Imports and exports
Both import and export prices rose higher in November. Import prices rose 0.7% after increasing 1.5% in the prior month. Prices for imports have risen each month of 2021, except for a 0.2% decline in August. Since November 2020, import prices have advanced 11.7%, the largest 12-month increase since prices climbed 12.7% for the period ended in September 2011. Import fuel prices continued to increase, rising 2.0% in November. Import fuel prices have advanced 86.1% since November 2020. Excluding fuel prices, import prices rose 0.5% in November and are up 1.6% for the last 12 months. Export prices increased 1.0% in November after rising 1.6% in October. Export prices increased 18.2% over the 12 months ended in November, the largest 12-month advance since data was first published in September 1984.
The international trade in goods deficit was $97.8 billion in November, up $14.6 billion, or 17.5%, from October. Exports of goods were $154.7 billion in November, $3.3 billion less than in October. Imports of goods were $252.4 billion in November, $11.3 billion more than in October. The November drop in exports was widespread, with only foods, feeds, and beverages increasing. On the other hand, each category of imports rose, led by industrial supplies, consumer goods, and automotive vehicles.
The latest information on international trade in goods and services, out December 7, is for October and shows that the goods and services trade deficit was $161.1 billion, a decrease of $14.3 billion, or 17.6%, from the September deficit. October exports were $223.6 billion, 8.1%, more than September exports. October imports were $290.7 billion, 0.9%, more than September imports. Year to date, the goods and services deficit increased $161.1 billion, or 29.7%, from the same period in 2020. Exports increased $315.1 billion, or 17.9%. Imports increased $476.8 billion, or 20.7%.
International markets
Despite several countries reporting record numbers of COVID-19 cases, global economic recovery has been fairly steady, as several nations around the world held off from imposing fresh lockdowns. Gross domestic product rose in several countries including the United Kingdom (6.9%), the Eurozone (5.2%), Germany (2.9%), Japan (1.6%), and China (7.7%). Crude oil prices dipped below $80.00 per barrel following their biggest rise since 2009. And stock markets were poised to close the year well above where they started in 2021. For 2021, the STOXX Europe 600 Index rose 22.3%; the United Kingdom’s FTSE advanced 14.3%; Japan’s Nikkei 225 Index climbed 4.9%; and China’s Shanghai Composite Index gained 4.8%.
Consumer confidence
The Conference Board Consumer Confidence Index® increased in December. The index stands at 115.8, up from 111.9 in November (revised). The Present Situation Index, based on consumers’ assessment of current business and labor market conditions, was relatively flat at 144.1 in December, down from 144.4 the previous month. The Expectations Index — based on consumers’ short-term outlook for income, business, and labor market conditions — increased to 96.9 in December, up from November’s reading of 90.2.
2022 Key Numbers
Individual Income Tax Planning
Alternative Minimum Tax (AMT), child tax credit, earned income tax credit, itemized deductions, kiddie tax, personal exemptions, and more.
2022 Federal Income Tax Rate Schedules
(Individuals, Trusts, and Estates)
Tax rates for all filing statuses.
2021 Federal Income Tax Rate Schedules
(Individuals, Trusts, and Estates)
Tax rates for all filing statuses.
Business Planning
Earnings subject to FICA taxes, Section 179 expensing, standard mileage rate, and more.
Education Planning
Coverdell education savings account limits, education loan interest deduction limits, American Opportunity and Lifetime Learning Credits, and more.
Protection Planning
Eligible long-term care premium deduction limits, Archer Medical Savings Accounts, and Health Savings Accounts (HSAs).
Estate Planning
Annual gift tax exclusion, estate tax applicable exclusion amount, gift tax applicable exclusion amount, GSTT exemption, and more.
Retirement Planning
Elective deferral limits, IRA contribution limits, additional “catch-up” limits, traditional deductible IRA and Roth IRA compensation limits, and more.
Investment Planning
Tax rates on long-term capital gains and dividends, additional Medicare contribution tax on unearned income.
Premier Wealth Advisors Annual Notice
As an SEC-registered investment adviser, we are required to provide a summary of the material changes to our most recent disclosure brochure as set forth on Form ADV Part 2. If you would like a copy of the entire brochure please contact us at info@yourpremierwealth.com.
Furthermore, additional information about our firm is available on Part 1 of Form ADV which is available at adviserinfo.sec.gov. If you are unable to access this site or would like us to send you a copy, please contact us for a printed copy by calling us at 212-752-4343 extension 221.
We strive to meet with all our ongoing investment advisory clients at least once a year to review our previous services and recommendations and to discuss the impact of any changes in your financial situation or investment objectives. If you would like to meet with us, please contact us to schedule a mutually convenient meeting. Regardless, you should always contact us immediately if there are any changes in your financial situation or investment objectives or if you wish to add or modify any reasonable restrictions to the management of your account.
As always, should you have any questions or require any additional information regarding this Annual Notice, please do not hesitate to contact us.
Sincerely,
The Dow Jones Industrial Average (DJIA) is a price-weighted index composed of 30 widely traded blue-chip U.S. common stocks. The S&P 500 is a market-cap weighted index composed of the common stocks of 500 leading companies in leading industries of the U.S. economy. The NASDAQ Composite Index is a market-value weighted index of all common stocks listed on the NASDAQ stock exchange. The Russell 2000 is a market-cap weighted index composed of 2,000 U.S. small-cap common stocks. The Global Dow is an equally weighted index of 150 widely traded blue-chip common stocks worldwide. Market indices listed are unmanaged and are not available for direct investment.
All third-party materials are the responsibility of their respective authors, creators, and/or owners. First Allied is not responsible for third-party materials, and the information reflects the opinion of its authors, creators, and/or owners at the time of its issuance, which opinions and information are subject to change at any time without notice and without obligation of notification.
These materials were obtained from sources believed to be reliable and presented in good faith, nevertheless, First Allied has not independently verified the information contained therein, and does not guarantee its accuracy or completeness.
The information has no regard to the specific investment objectives, financial situation, or particular needs of any specific recipient, and is intended for informational purposes only and does not constitute a recommendation, or an offer, to buy or sell any securities or related financial instruments, nor is it intended to provide tax, legal or investment advice. We recommend that you procure financial and/or tax advice as to the implications (including tax) of investing in any of the companies mentioned.
PREMIER WEALTH ADVISORS
NEW YORK
1411 Broadway, 16th Floor
New York, NY 10018
(800) 499-4143
LONG ISLAND
626 RXR Plaza, 6th Floor
Uniondale, NY 11856
(516) 778-5822
All content on the Premier Wealth Advisors, LLC. websites are provided for informational purposes only and are deemed to be from reliable sources. However, no warranty, expressed or implied, is made regarding its presentation.
This content should not be viewed as a recommendation, offer, or solicitation by PWA to buy, sell, or hold any security or financial product, nor does it endorse any specific investment strategy. Past performance does not guarantee future results, and all investments carry the potential for loss.
PWA manages portfolios based on each client’s specific investment needs, as specified in a signed investment advisory agreement. As a result, each client’s portfolio reflects unique circumstances and investment outcomes. PWA’s outlook and strategies may change based on updated client information, or if material or significant shifts in economic and financial market conditions occur.
While PWA aims to add value in areas beyond investments, such as tax and estate planning, we do not claim to be income tax professionals or estate planning attorneys. You should consult your tax advisor and/or estate planning attorney for legal or accounting needs.
Advisory Services are offered through Premier Wealth Advisors, LLC. an SEC Registered Investment Adviser.