
March 2022 Perspective
The financial fallout from the crisis in Ukraine is escalating rapidly, along with an intensification of violence and battles throughout the country. Vladimir Putin has put Russia’s nuclear forces on alert and a convoy of Russian vehicles is now said to be nearing Kyiv. Ukrainian resistance has been heroic and much tougher-than-expected, but they will have a difficult time defending against Russian aggression. Diplomatic progress is also seen as unlikely as officials from both sides met earlier this week for the first talks since the start of the invasion, while the EU upended years of policy by supplying weapons to a “country at war” for the first time in its history.
Western sanctions have sent the Russian ruble into a nosedive, with the currency tumbling 30% to an all-time low versus the dollar. In response, Russia’s central bank more than doubled its key interest rate to 20%, closed the country’s stock market, and freed local bank reserves to boost liquidity.
The situation in Ukraine is changing daily and the headlines and images are truly disturbing. Russia is likely to face long-term adverse diplomatic, trade, financial, and economic consequences for years to come. In addition, this does not appear to be a very popular move as many Russians and Ukrainians are literally kinsfolk, and this path took the population by surprise. The shock is particularly acute for the middle-class Russians with aspirations for their families— it is sad to think that they now face the prospect of international isolation and diminishing opportunity.
The past few weeks have been marred by Russia’s commitment to unnecessary military action in Ukraine. Our thoughts and concerns are with those directly and indirectly affected by the conflict.
Economic and Market Implications
Our view is that this conflict will most likely stay local and will not turn into a larger regional or global conflict. The US and EU have made it clear that their preferred response is economic sanctions on Russia and the Russian elite. The main question for the markets is what impact this conflict will have on US corporate earnings. It is our opinion that there will be very little impact on earnings because, for the most part, US companies have low exposure to the Russian and Ukrainian markets.
As far as the global economy, energy security is the main issue. Russia is the third-largest producer of oil in the world, the largest provider of natural gas to western Europe, and a leading supplier of other commodities(1). Ukraine is also one of the world’s major grain producers, alongside North and South America. Nations that have relied on energy, food, and other raw materials from Russia and Ukraine will now begin to diversify their suppliers. For example, the European continent relies on Russia for approximately 40% of its current natural gas requirements (2). Liquified natural gas is likely to be a significant alternative, and countries like the United States and Qatar would help fill the gap of reduced reliance on Russian supply. This shift looks to have already begun, as natural gas flows from Russia to Europe declined by 30% in the first half of 2021 and 40% in the second half of 2021 relative to the same periods in 2020.
Will inflationary pressure caused by higher oil prices force the Fed to tighten faster than the market expects?
In the near term, rising energy, food, and other commodity prices will push up headline inflation rates. The pandemic, global supply chain disruptions, fiscal and monetary policy, and surging demand in 2021 have already unleashed strong gains in wages and prices. Fed policy has little to no impact on the price of oil so we do not believe this conflict will force the Fed to act faster due to higher energy prices. Expectations are that the FOMC will raise rates four times this year, with the first hike occurring at the March meeting. Oil price shocks into a conflict are normal and history has shown that they typically do not last long.
The economy is slowing from the growth of 2021, is there a risk of a recession?
While it is true growth the US economy is slowing year-over-year, it is important to remember that real US GDP growth in 2021 was just shy of 6%, the highest rate since 1984. Estimates for 2022 are for real GDP growth in the US to be approximately 3.5%, which while lower than 2021, it would still be the highest growth rate since 2004. This is a positive macroeconomic backdrop and not a sign of a recession. The economy will still get a boost from reopening from the pandemic and this strength should help continue to drive earnings higher for US companies. Stocks follow earnings over time and earnings estimates for 2022 are up about 10% vs. 2021 and higher still for 2023 and 2024. Bottom line – we believe a recession is highly unlikely anytime soon.
What should investors do now?
While volatility may continue in the near term, we remain optimistic for US equities. We understand that with the dramatic swings in the markets, it can be tempting to react to headlines and quickly change course with a well-thought-out investment strategy. Unfortunately, this often leads to poorly timed investment decisions. One thing you can do is to ensure that your portfolio strategy is in sync with your specific investment objective and most importantly, your investment time frame. Has anything changed in your life that warrants a change in your risk profile? If you don’t have a near-term liquidity need and have a portfolio with a long-term investment objective, history has shown that often the best move is to stay the course and stay invested.
In this evolving economic climate, we are adjusting portfolios for the end of easy money and supportive monetary policies, maintaining broad diversification, allocating to the sectors, industries, and investment factors that we believe will outperform, while monitoring potential challenges. As Warren Buffett has famously put it, “you want to be fearful when others are greedy and greedy when others are fearful”.
1 Source: IMF WEO, IEA, USDA, Blomberg 2 Institute of International Finance 3 Dow Jones
Do you understand the risk in your Portfolio?
At PWA, we can help you with a complimentary Risk Analysis Review. We use sophisticated portfolio analytics to run stress tests on portfolio allocations. We can then provide you with a report on how a portfolio may perform in different economic and market scenarios. The more informed you are about how your investments are positioned, the more you can relax, sleep well, and enjoy the things you love most.
Contact us at 800-499-4143 extension 3 or send an email to info@yourpremierwealth.com with any questions you may have.
Colliding Forces: Russia, Oil, Inflation, and Market Volatility
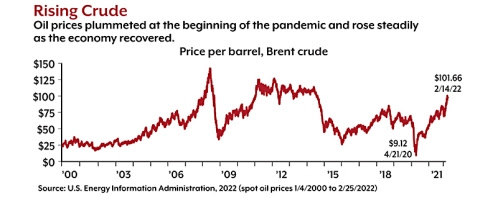
The Russian invasion of Ukraine has drawn condemnation and punitive sanctions from the United States, Europe, and their allies. The humanitarian cost of war cannot be measured, and the long-term economic effects could take months or years to unfold. However, the early stages of the conflict pushed oil prices upward and sent the U.S. stock market plunging, only to see stocks bounce back and drop again — with more volatility likely.1
For now, it may be helpful to look at how the Russia-Ukraine conflict might affect the global oil market as well as U.S. consumers and investors.
The Russian Threat
Russia produces about 10% of the world’s oil and is the second-largest exporter behind Saudi Arabia. Any disruption of Russian oil exports would have a significant effect on global supplies and drive prices higher.5–6
The United States — the world’s largest oil producer and consumer — imports only about 3% of its daily oil consumption from Russia, which could be replaced by other sources.7–8 The greatest effect of a disruption would be on Europe, which imports about 25% of its oil and 40% of its natural gas from Russia.9 Central and eastern European countries would be especially vulnerable.10
It’s unlikely that Russia would cut off oil and gas supplies unilaterally, because it depends on the revenue as much as Europe depends on the energy.11 In the longer term, however, Russia may shift energy exports from Europe to China, forcing Europe to develop other sources.12 U.S. and European officials have indicated that sanctions on Russia will not include energy industries, but the exclusion of Russian banks from the SWIFT global payments system could affect the purchase of oil and natural gas.13
Other Russian exports that may be affected by sanctions or a prolonged conflict include wheat, corn, and precious metals like nickel, aluminum, and palladium. Ukraine is also a major exporter of wheat and corn, and Russian and Ukrainian grain supplies are essential to many countries in the Middle East, Africa, and Asia. While any breakdown of these supplies would not directly affect the United States, they could cause widespread hardship and place greater strain on the global economy.14
Pain at the Pump
Theoretically, high oil prices drive inflation because higher expenses for fuel and raw materials for petroleum-based goods may be passed on to consumers. This happened during the 1970s, but the connection has not been so clear in recent years. In 2014, the last time oil prices exceeded $100 per barrel, annual inflation was under 2%.15
Oil prices affect gas prices, and high gas prices are exacerbating a broad inflationary trend driven by supply-chain disruptions and high consumer demand. While general inflation increased 7.5% for the 12-month period ending in January 2022, gas prices increased 40%, and the Russia-Ukraine conflict has pushed them further upward.16 The national average price of unleaded regular gasoline was $3.61 per gallon at the end of February, about 90 cents higher than one year earlier.17
With the Russian invasion, it’s likely that gas prices may spike even higher, driven by global concerns rather than any severe supply issues in the United States. Whether prices stay high might depend in part on consumer behavior. If gasoline consumption remains high regardless of price, it would feed the inflationary spiral, whereas if consumers cut back on driving in response to high prices, it could bring prices downward.18
Geopolitics and the Market
As with inflation, high oil prices theoretically have a negative impact on the stock market due to increased energy costs for businesses and less discretionary income for consumers. However, an older study from the Federal Reserve found surprisingly little correlation between oil prices and stock market performance.19 Even so, rising prices over the last few months have paralleled a period of stock market volatility and seem to be a contributing factor.
The market ups and downs triggered by the Russian invasion suggest that investors can expect rocky times ahead, but it’s impossible to guess how long volatility might last. Most geopolitical events, no matter how serious, have relatively brief effects on the market, often settling in days. However, the Iraqi invasion of Kuwait in 1990 had a major impact, and it took six months for the market to recover.20
Regardless of how events unfold, the stock market is primarily driven by U.S. business activity. Although high oil prices and armed conflict are causes for concern, it’s important to make investment decisions based on logic rather than emotions. For most investors, it’s wise to maintain a steady strategy designed for their personal goals and risk tolerance.
Past geopolitical events & the markets – a historical view
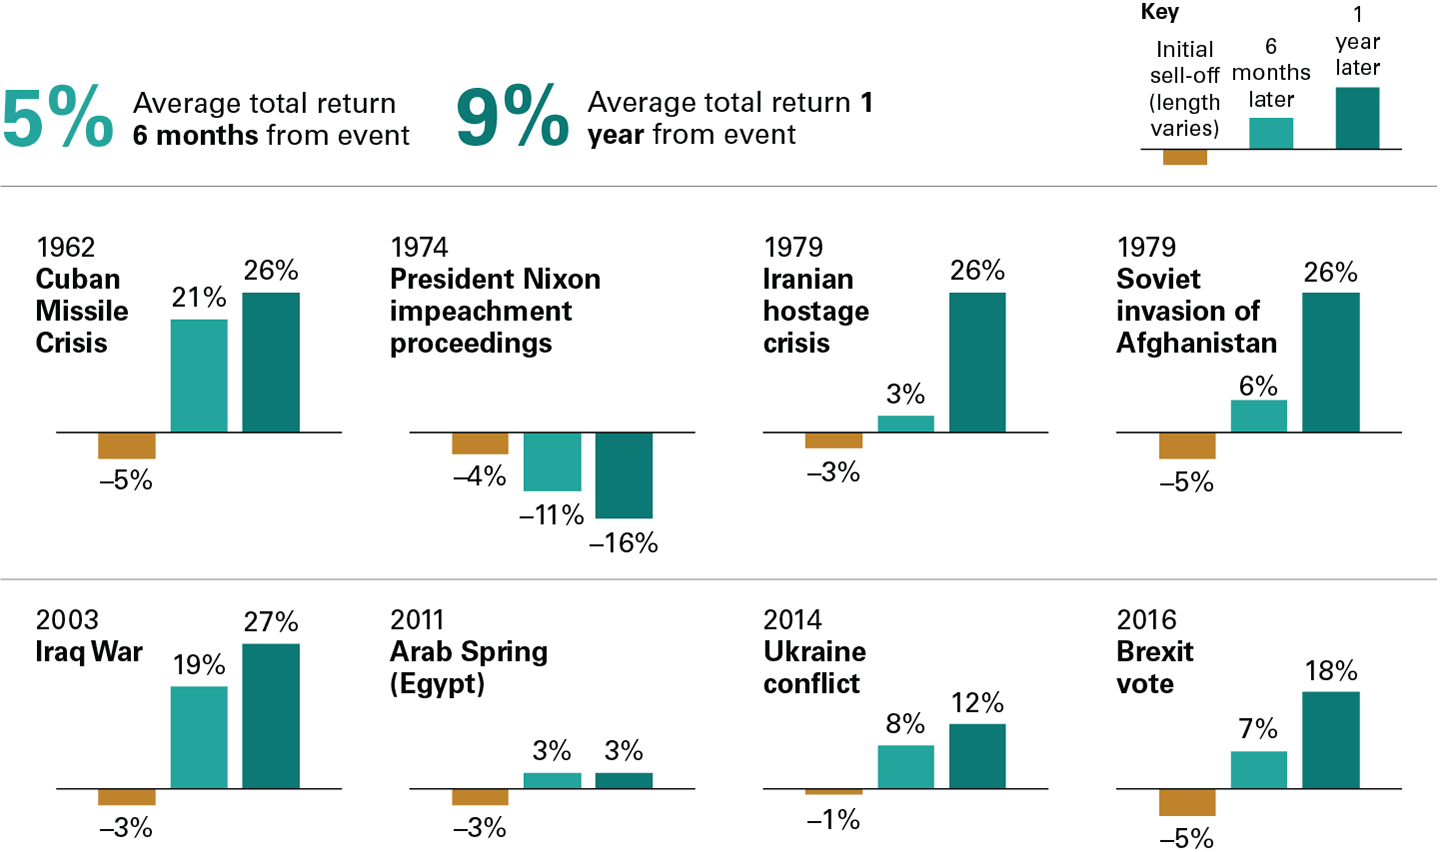
Over the past 60 years, the beginning of every major conflict coincided (roughly) with the low point for the S&P 500. Major geopolitical events such as what we are currently experiencing initially caused a spike in volatility and a sharp decline in the equity markets. However, those declines were typically short-lived and over the following 6 and 12-month periods, the market rebounded. On average, stocks returned 5% in the 6 months following the events and 9% in the 12 months after the events as shown in the illustration below.
While there is much uncertainty and volatility may remain high in the short term, it is our opinion that the market will soon start to find its footing and assess what impact the conflict will have on the global economy and corporate earnings.
Past performance is no guarantee of future returns. The performance of an index is not an exact representation of any particular investment, as you cannot invest directly in an index.
Notes: Returns are based on the Dow Jones Industrial Average through 1963 and the Standard & Poor’s 500 Index thereafter. All returns are price returns. Not shown in the above charts, but included in the averages, are returns after the following events: the Suez Crisis (1956), construction of the Berlin Wall (1961), the assassination of President Kennedy (1963), authorization of military operations in Vietnam (1964), Israeli-Arab Six-Day War (1967), Israeli-Arab War/oil embargo (1973), the shah of Iran’s exile (1979), U.S. invasion of Grenada (1983), U.S. bombing of Libya (1986), First Gulf War (1991), President Clinton’s impeachment proceedings (1998), Kosovo bombings (1999), multi-force intervention in Libya (2011), and U.S. anti-ISIS intervention in Syria (2014). Sources: Refinitiv.
February Market Review
Wall Street opened the month on a high note, with each of the benchmark indexes advancing. A stronger-than-expected jobs report and solid fourth-quarter corporate earnings data helped support equities. Nevertheless, concerns about the Russia-Ukraine situation began to worry investors. Natural gas and crude oil prices climbed higher. Throughout much of February, the impending crisis in Eastern Europe seemed to displace thoughts about a likely interest-rate hike from the Federal Reserve in March.
Then on Thursday, February 24, Russia launched attacks against multiple strategic targets in Ukraine. The United States, European Union, United Kingdom, Germany, Canada, Australia, and Japan responded to the Russian incursion by imposing sanctions mostly targeting Russian banks, oligarchs, and high-tech sectors, along with travel restrictions. The conflict shook global financial markets as stocks plunged. Oil and gas prices surged globally amid concerns that heating bills and food prices would skyrocket. Brent crude oil prices reached $100 per barrel. The invasion heightened the pressure on a global economy already reeling from snarled supply chains and the highest inflation in years.
As fighting continued throughout the last days of February, Western countries announced additional sanctions against Russia. Even Switzerland broke from its customary neutral stance to join the European Union in its actions. The United States, United Kingdom, Canada, and European Union blocked several major Russian banks from participating in the SWIFT payment system.
As the ruble fell, Russia’s central bank raised interest rates to 20.0%. Russian President Vladimir Putin put the country’s nuclear arms facilities on high alert. Several global companies cut ties with Russia. Canada banned Russian crude oil imports as U.S energy shares climbed higher. A meeting of delegates from Ukraine and Russia on the last day of February produced no immediate resolutions, particularly toward a cease-fire, as the conflict waged on.
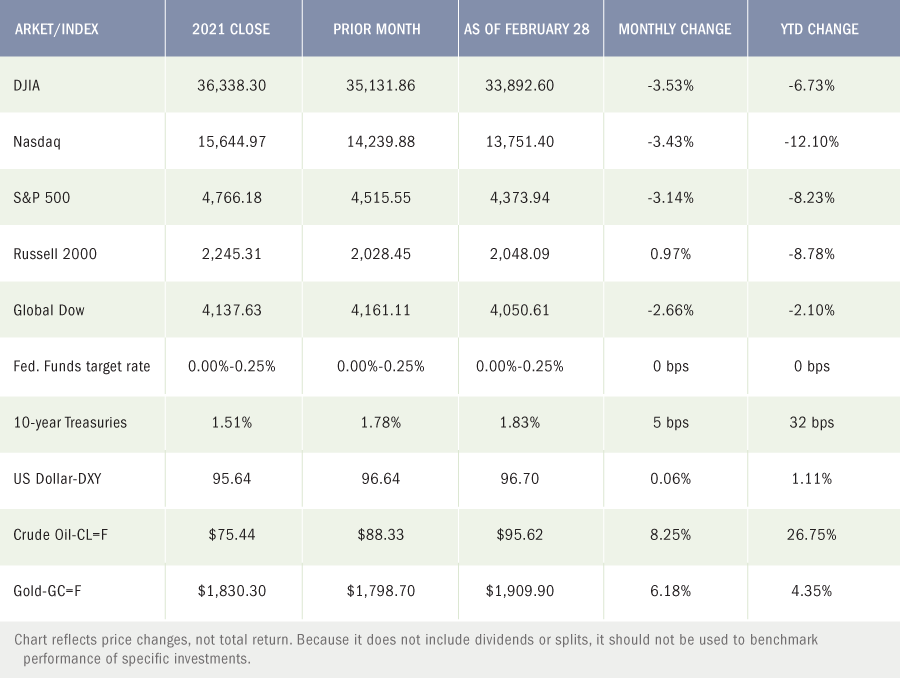
Global stocks took the brunt of the turmoil. Domestically, the benchmark indexes seemed to respond more to a rise in inflationary pressures than the conflict in Eastern Europe. Nevertheless, for the second consecutive month, each of the benchmark indexes listed below fell, led by the Dow, followed by the Nasdaq, the S&P 500, and the Global Dow. The small caps of the Russell 2000 were able to post a gain.
Ten-year Treasury yields bounced up and down throughout the month, finally settling at 1.83%. Domestically, crude oil prices advanced, but not at the pace of Brent crude, which rose to $100.99 per barrel. Prices at the pump rose in February as the national average retail price for regular gasoline was $3.530 per gallon on February 21, up from the January 24 price of $3.323 per gallon. Gold prices increased notably, hitting a one-year high after rising to nearly $1,900.00 per ounce.
Market Numbers – As of February 28, 2022
Latest Economic News
Employment
Employment rose by 467,000 in January, marginally below the December 2021 revised total of 510,000. Employment has increased by 19.1 million since April 2020 but is down by 2.9 million, or 1.9%, from its pre-pandemic level in February 2020. The unemployment rate inched up by 0.1 percentage point to 4.0%. The number of unemployed persons increased by 184,000 in January to 6.5 million. Since January 2021, the unemployment rate fell 2.4 percentage points and the number of unemployed persons dropped 3.7 million. While both measures are down considerably from their highs at the end of the February-April 2020 recession, they remain above their levels prior to the coronavirus pandemic (3.5% and 5.7 million, respectively, in February 2020). Among the unemployed, the number of workers who permanently lost their jobs declined by 100,000 to 1.6 million in January. Conversely, the number of workers who voluntarily left their jobs increased from 228,000 to 952,000. Also in January, the number of persons who were unable to work because their employer closed or lost business due to the pandemic jumped to 6.0 million from 3.1 million in December 2021. The labor force participation rate increased 0.3 percentage points to 62.2% in January. The employment-population ratio increased by 0.2 percentage points to 59.7%. In January, average hourly earnings increased by $0.23 to $31.63. Over the last 12 months, average hourly earnings rose by 5.7%. The average work week fell by 0.2 hour to 34.5 hours in January.
There were 232,000 initial claims for unemployment insurance for the week ended February 19. Over the course of 2021 and through the first two months of 2022, initial weekly claims and total claims for unemployment insurance benefits steadily decreased. As of February 12, there were 1,476,000 total claims for unemployment benefits. This is the lowest level for insured unemployment since March 14, 1970, when it was 1,456,000. A year ago, there were 4,469,000 total claims for unemployment insurance benefits.
FOMC / interest rates
The Federal Open Market Committee did not meet in February. However, it is expected the federal funds target rate range will be adjusted higher following the March meeting.
GDP / budget
Gross domestic product rose 7.0% in the fourth quarter of 2021 compared with a 2.3% advance in the third quarter. Consumer spending, as measured by personal consumption expenditures, climbed 3.1% in the fourth quarter (2.0% in the third quarter). The PCE price index, a measure of inflation, increased 6.3% in the fourth quarter after advancing 5.3% in the third quarter. Gross private domestic investment, which includes nonresidential and residential fixed investment, vaulted 33.5% in the fourth quarter after gaining 12.4% in the third quarter. Nonresidential (business) fixed investment increased 3.1% (1.7% in the third quarter), while residential fixed investment increased 1.0% (-7.7% in the third quarter). Exports jumped 23.6% in the fourth quarter after falling 5.3% in the prior quarter. Imports climbed 17.6% following a 4.7% rise in the third quarter.
The Treasury budget posted a notable surplus of $118.7 billion in January, the first monthly surplus since September 2019. By comparison, the budget deficit was $162.8 billion in January 2021. The January 2022 surplus helped shrink the overall cumulative deficit for the first four months of fiscal year 2022 to $259.0 billion, 65.0% lower than the deficit over the same period in fiscal year 2021. So far for fiscal year 2022, individual income tax receipts have risen 43.0% and corporate income tax receipts have increased 32.0%. In January, government expenditures fell 8.0% to $1.78 billion, while receipts rose 28.0% to $1.52 billion. In January, budget outlays fell 37.0% to $346.4 billion, while receipts increased 21.0% to $465.1 billion.
Inflation / Consumer Spending
According to the latest Personal Income and Outlays report for January, personal income rose less than 0.1%, while disposable personal income inched up 0.1% after increasing 0.4% and 0.2%, respectively, in December 2021. Consumer spending increased 2.1% following a 0.8% decrease in December. Consumer prices climbed 0.6% in January after advancing 0.5% in December. Consumer prices have risen 6.1% since January 2021. Prices for energy goods and services increased 1.1% in January and 25.9% over the past 12 months. Food prices rose 0.9% in January and 6.7% since January 2021.
The Consumer Price Index climbed 0.6% in January, the same increase as in the previous month. Since January 2021, the CPI has risen 7.5% — the largest 12-month gain since February 1982. Price growth was broad-based, with most major categories showing an increase, led by fuel oil (9.5%) and electricity (4.2%). Prices for food rose 0.9% in January. Energy prices increased 0.9%, although gasoline prices dipped 0.8%. Prices for new cars were flat, but used-car prices rose 1.5%. Over the last 12 months, energy prices have risen 27.0%, driven higher by gasoline prices (40.0%) and fuel oil (46.5%). Food prices have increased 7.0%, while prices for used cars and trucks have climbed 40.5%.
Prices that producers receive for goods and services jumped 1.0% in January following a 0.4% increase in December 2021. Producer prices have increased 9.7% since January 2021. Prices less foods, energy, and trade services increased 0.9% in January, the largest increase since rising 1.0% in January 2021. For the year, prices less foods, energy, and trade services moved up 6.9%. Prices for services increased 0.7%. A major factor in the January increase in the prices for services was hospital outpatient care prices, which rose 1.6%. Prices for goods rose 1.3%, as prices for motor vehicles and equipment rose 0.7%.
Housing
Sales of existing homes rose 6.7% in January, rebounding from a 3.8% decrease the previous month. Despite the January increase, existing home sales were still 2.3% under the January 2021 estimate. The median existing-home price was $350,300 in January, down from $358,000 in December 2021 and 15.4% lower than January 2021 ($303,600). Unsold inventory of existing homes represents a 1.6-month supply at the current sales pace, down from 1.7 months in December. Sales of existing single-family homes increased 6.5% in January after falling 4.3% the previous month. Since January 2021, sales of existing single-family homes have fallen 2.4%. The median existing single-family home price was $357,100 in January, down from $364,300 in December.
Sales of new single-family homes fell 4.5% in January after advancing 11.9% in December 2021. The median sales price of new single-family houses sold in January was $423,300 ($395,500 in December). The January average sales price was $496,900 ($482,300 in December). The inventory of new single-family homes for sale in January represented a supply of 6.1 months at the current sales pace, up from December’s 5.6-month supply. Sales of new single-family homes in January 2022 were 19.3% below the January 2021 estimate.
Manufacturing
Industrial production increased 1.4% in January following a 0.1% decline in December 2021. In January, manufacturing rose 0.2% and mining increased 1.0%, while utilities jumped 9.9% after a surge in demand for heating. Total industrial production in January was 4.1% higher than it was a year earlier and 2.1% above its pre-pandemic (February 2020) reading. Since January 2021, manufacturing has risen 2.5%, mining has jumped 8.2%, and utilities have increased 9.3%.
January saw new orders for durable goods increase 1.6% after increasing 1.2% (revised) in December. Excluding transportation, new orders increased 0.7% in January. Excluding defense, new orders increased 1.6%. Transportation equipment contributed to the increase in new orders, climbing 3.4% in January. Over the last 12 months, new orders for durable goods increased 16.5%.
Imports and exports
Both import and export prices jumped higher in January. Import prices rose 2.0% after decreasing 0.4% in the prior month. The January rise in import prices was the largest monthly increase since April 2011. For the 12 months ended in January 2022, prices for imports have advanced 10.8%. Excluding import fuel, import prices increased 1.4% in January — the largest one-month advance since January 2002. Higher prices for nonfuel industrial supplies and materials; foods, feeds, and beverages; capital goods; consumer goods; and automotive vehicles contributed to the January increase in nonfuel import prices. Import fuel prices rose 9.3% in January, driven higher by higher petroleum and natural gas prices. Import fuel prices have advanced 60.3% over the past 12 months. Export prices rose 2.9% in January after falling 1.6% in December 2021. The January advance in export prices was the largest since January 1989. Higher prices for both agricultural and nonagricultural exports in January contributed to the overall increase in U.S. export prices. Export prices have risen 15.1% since January 2021.
The international trade in goods deficit was $107.6 billion in January, up $7.2 billion, or 7.1%, from December. Exports of goods were $154.8 billion in January, $2.8 billion less than in December. Imports of goods were $262.5 billion, $4.4 billion more than December imports.
The latest information on international trade in goods and services, released February 8, is for December 2021 and shows that the goods and services trade deficit rose by $1.4 billion to $80.7 billion from the November 2021 deficit. December exports were $228.1 billion, $3.4 billion more than November exports. December imports were $308.9 billion, $4.8 billion more than November imports. For 2021, the goods and services deficit increased $182.4 billion, or 27.0%, from the same period in 2020. Exports increased $394.1 billion, or 18.5%. Imports increased $576.5 billion, or 20.5%.
International markets
The Russia-Ukraine crisis shook the globe since the Russian military operation against Ukraine began on Thursday, February 24. Several countries, including Great Britain and Japan, along with the European Union, imposed sanctions against Russia and its leadership. Benchmark indexes in Europe and Asia fell and oil prices surged in the immediate aftermath of Russia’s advance into the Ukraine. The FTSE 100 in London fell 2.5%, the German DAX dropped 4.0%, the Nikkei 225 in Japan dipped 1.8%, and the CAC in Paris lost 3.6%. Overall, for the markets in February, the STOXX Europe 600 Index dropped 2.6%; the United Kingdom’s FTSE gained 0.3%; Japan’s Nikkei 225 Index dipped 1.0%; and China’s Shanghai Composite Index climbed 2.7%.
Consumer confidence
The Conference Board Consumer Confidence Index® fell slightly in February following a decline in January. The index stands at 110.5, down from 111.1 in January. The Present Situation Index, based on consumers’ assessment of current business and labor market conditions, improved to 145.1 in February, up from 144.5 in January. The Expectations Index, based on consumers’ short-term outlook for income, business, and labor market conditions, declined to 87.5 in February, down 88.8 in January.
Premier Wealth Advisors Annual Notice
As an SEC registered investment adviser, we are required to provide a summary of the material changes to our most recent disclosure brochure as set forth on Form ADV Part 2. If you would like a copy of the entire brochure please contact us at info@yourpremierwealth.com.
Furthermore, additional information about our firm is available on Part 1 of Form ADV which is available at adviserinfo.sec.gov. If you are unable to access this site or would like us to send you a copy, please contact us for a printed copy by calling us at 212-752-4343 extension 221.
We strive to meet with all our ongoing investment advisory clients at least once a year to review our previous services and recommendations and to discuss the impact of any changes in your financial situation or investment objectives. If you would like to meet with us, please contact us to schedule a mutually convenient meeting. Regardless, you should always contact us immediately if there are any changes in your financial situation or investment objectives or if you wish to add or modify any reasonable restrictions to the management of your account.
As always, should you have any questions or require any additional information regarding this Annual Notice, please do not hesitate to contact us.
Sincerely,
Premier Wealth Advisors, LLC
John L. Diaz, CFP
CEO & Senior Wealth Strategist
Chief Compliance Officer
Data sources: Economic: Based on data from U.S. Bureau of Labor Statistics (unemployment, inflation); U.S. Department of Commerce (GDP, corporate profits, retail sales, housing); S&P/Case-Shiller 20-City Composite Index (home prices); Institute for Supply Management (manufacturing/services). Performance: Based on data reported in WSJ Market Data Center (indexes); U.S. Treasury (Treasury yields); U.S. Energy Information Administration/Bloomberg.com Market Data (oil spot price, WTI, Cushing, OK); www.goldprice.org (spot gold/silver); Oanda/FX Street (currency exchange rates). News items are based on reports from multiple commonly available international news sources (i.e., wire services) and are independently verified when necessary with secondary sources such as government agencies, corporate press releases, or trade organizations. All information is based on sources deemed reliable, but no warranty or guarantee is made as to its accuracy or completeness. Neither the information nor any opinion expressed herein constitutes a solicitation for the purchase or sale of any securities, and should not be relied on as financial advice. Forecasts are based on current conditions, subject to change, and may not come to pass. U.S. Treasury securities are guaranteed by the federal government as to the timely payment of principal and interest. The principal value of Treasury securities and other bonds fluctuates with market conditions. Bonds are subject to inflation, interest
PREMIER WEALTH ADVISORS
NEW YORK
1411 Broadway, 16th Floor
New York, NY 10018
(800) 499-4143
LONG ISLAND
626 RXR Plaza, 6th Floor
Uniondale, NY 11856
(516) 778-5822
All content on the Premier Wealth Advisors, LLC. websites are provided for informational purposes only and are deemed to be from reliable sources. However, no warranty, expressed or implied, is made regarding its presentation.
This content should not be viewed as a recommendation, offer, or solicitation by PWA to buy, sell, or hold any security or financial product, nor does it endorse any specific investment strategy. Past performance does not guarantee future results, and all investments carry the potential for loss.
PWA manages portfolios based on each client’s specific investment needs, as specified in a signed investment advisory agreement. As a result, each client’s portfolio reflects unique circumstances and investment outcomes. PWA’s outlook and strategies may change based on updated client information, or if material or significant shifts in economic and financial market conditions occur.
While PWA aims to add value in areas beyond investments, such as tax and estate planning, we do not claim to be income tax professionals or estate planning attorneys. You should consult your tax advisor and/or estate planning attorney for legal or accounting needs.
Advisory Services are offered through Premier Wealth Advisors, LLC. an SEC Registered Investment Adviser.