
March 2020 Perspective
U.S. markets rebounded strongly today with the biggest one day gain since 2009. The Dow Jones Industrial Average rose by +1,294.58 or 5.09% *, paring some of last week’s steep losses. With equity markets very oversold, today’s move was helped by hopes that global central banks will implement accommodative measures to cushion the fallout from a spreading coronavirus outbreak.
While I’m very happy to be looking at “green” as opposed to “red” on my market watchlists, by no means am I complacent or do I believe that the equity markets are just going to roar back from last week’s large declines. There remains too much uncertainty about the containment of the Coronavirus and we believe we will continue to see negative headlines. The unknown makes it very difficult to have a thorough understanding of the full global economic impact of this unfortunate event.
In our view, prior to this external shock, the equity markets were already ‘Priced for Perfection’ and a market correction was long overdue. For this reason, we had begun to position our equity strategies defensively, by concentrating on fundamental factors such as quality, value and low volatility. While this strong bounce is comforting, we believe it is prudent to remain defensive. We believe we will continue to see volatility, with wide swings both up and down for the foreseeable future. We will monitor this evolving situation closely and make adjustments to our investment models when warranted. Stay tuned!
U.S. markets rebounded strongly today with the biggest one day gain since 2009. The Dow Jones Industrial Average rose by +1,294.58 or 5.09% *, paring some of last week’s steep losses.
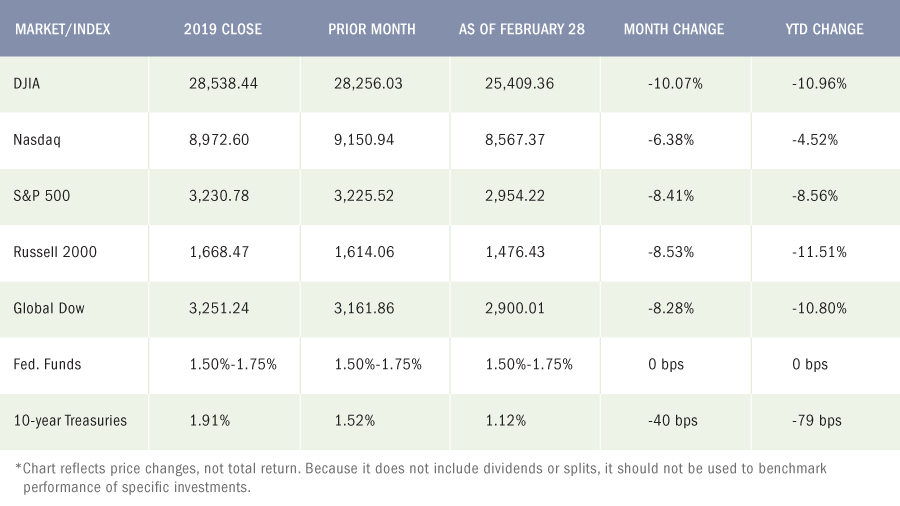
The Markets (as of market close February 28, 2020)
With a growing number of countries reporting new cases of the coronavirus, the obvious spread of this dreaded virus prompted a massive panic sell-off, the likes of which haven’t been seen since 2008. Investors’ fears of widespread economic tumult caused by the coronavirus were too much to ignore, despite last Friday’s statement from Fed chairman Jerome Powell that the central bank was prepared to cut rates if necessary when it meets in March. Crude oil prices fell by over $6 per barrel since the end of January. The 10-year Treasury note fell to a record low as money flowed into long-term bonds, pushing prices higher and yields lower.
By the close of trading on the last day of February, each of the benchmark indexes listed here sustained major losses, led by the Dow, which fell by more than 10.0%. The small-cap Russell 2000 dropped more than 8.50% for the month, followed by the S&P 500, the Global Dow, and the tech stocks of the Nasdaq. Year-to-date gains achieved in January and the first part of February were wiped out, with three of the benchmark indexes listed here trailing their 2019 closing values by double digits. The Russell 2000 fell by nearly 12.0%, followed by the Dow and the Global Dow, which lost close to 11.0%, respectively.
By the close of trading on February 28, the price of crude oil (WTI) was $45.19 per barrel, well below the January 31 price of $51.61 per barrel. The national average retail regular gasoline price was $2.466 per gallon on February 24, down from the January 27 selling price of $2.506 but $0.076 more than a year ago. The price of gold finished the month of February at $1,585.80, slightly lower than its January closing value of $1,592.70.
Do you understand the risk in your Portfolio?
At PWA, we can help you with a complimentary Risk Analysis Review. We use sophisticated portfolio analytics to run stress tests on portfolio allocations. We can then provide you with a report on how a portfolio may perform in different economic and market scenarios. The more informed you are about how your investments are positioned, the more you can relax, sleep well, and enjoy the things you love most.
Contact us at 800-499-4143 extension 3 or send an email to info@yourpremierwealth.com with any questions you may have.
A Look at the Numbers
Volatility – Let’s put it in Perspective – 3 things to remember
Market volatility is nothing new
Amid the scary headlines emanating from news outlets, it is important to remember that market volatility is normal, with a 10% pullback typically happening every year or two. Take a look at the chart below of the market data dating back to 1980. It shows that there is typically a pullback each year, but most years, the market has ended up positive with an average return of 13% *.
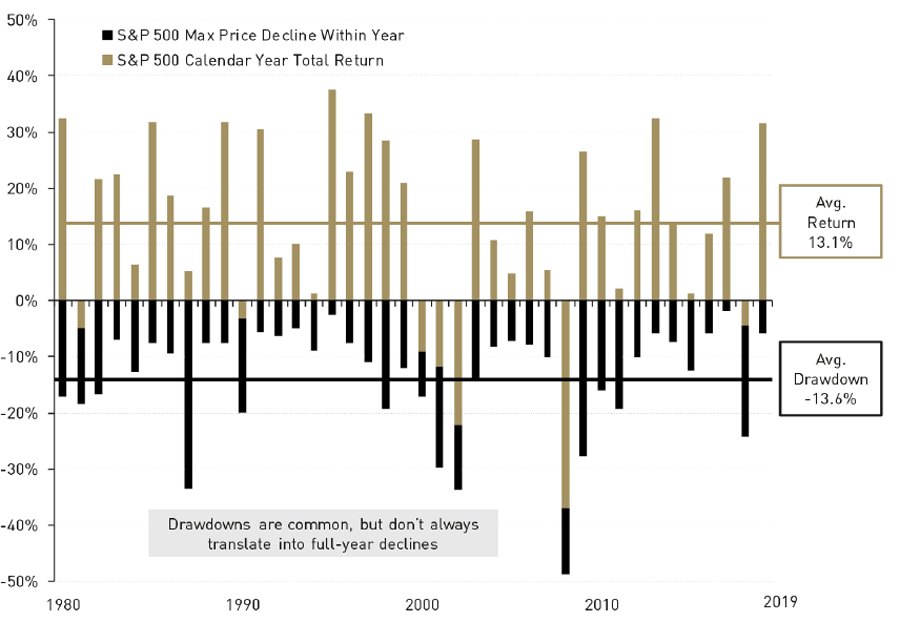
Source: Morningstar. Note: The historical data are for illustrative purposes only, do not represent the performance of any specific portfolio managed by Lord Abbett or any particular investment, and are not intended to predict or depict future results. Indexes are unmanaged, do not reflect the deduction of fees or expenses, and are not available for direct investment. Past performance is not a reliable indicator or guarantee of future results.
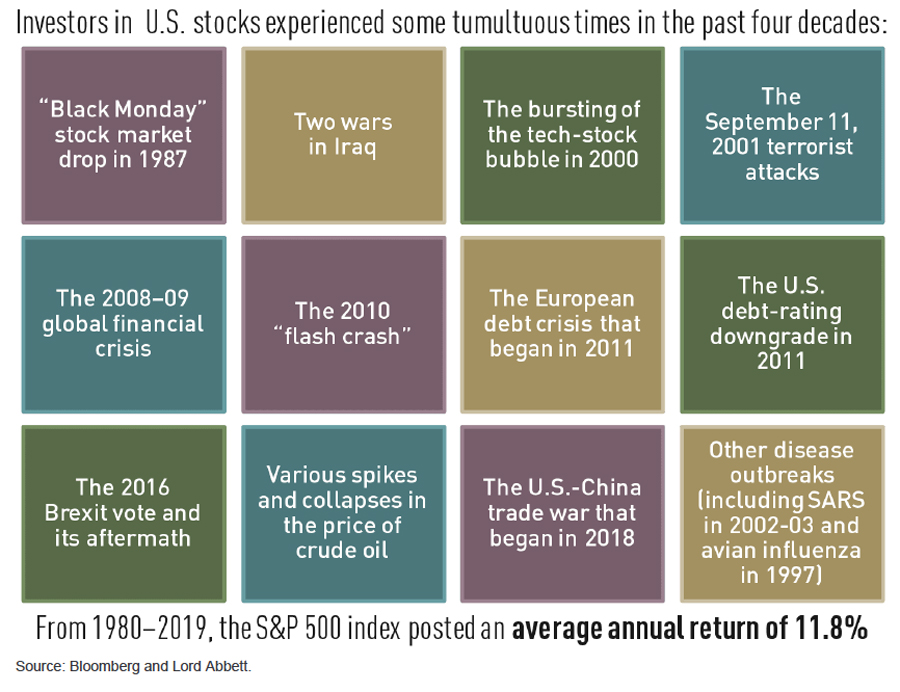
The market has been resilient following prior crises
While the coronavirus outbreak is indeed concerning, with the human and economic toll difficult to predict, we think it’s worth noting that the market has weathered a number of other negative events in the past several decades. Just look at this (partial) list of market shocks since 1980:
It’s not “timing the market,” it’s time in the market that matters most!
Periods of volatility can be alarming for investors, some of whom might flee the markets in an attempt to preserve capital, and then later try to time a reentry at the most opportune moment to rebuild wealth. Such a strategy is called “market timing.” For it to be successful, it would require an ability not only to forecast the future correctly but also to do so consistently over time—because, presumably, an investor would want to time future exits and entries as well. Very often, you will have big up days, following big down days and investors who try to time the market around this volatility, risk missing out on the potential long-term returns of the market. The chart below illustrates the growth of $10,000 in the S&P 500 for investors who missed the 10, 20, and 30 best days of market performance in the past 25 years.
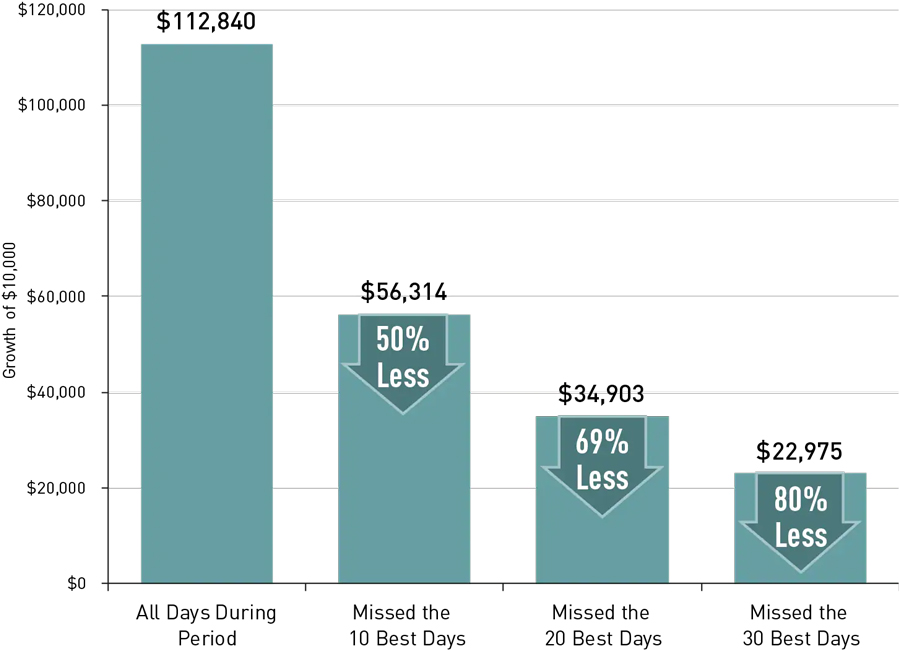
Source: Standard & Poors and Lord Abbett. Returns are measured based on the S&P 500® Index. The “best” days to be invested are defined as those on which the S&P 500 Index delivered its highest returns for the given periods based on historical data. Annualized return and total return assumes the reinvestment of all dividends and/or capital gains. Past performance is not a reliable indicator or a guarantee of future results. The historical data are for illustrative purposes only, do not represent the performance of any specific portfolio managed by Lord Abbett or any particular investment, and are not intended to predict or depict future results. Indexes are unmanaged, do not reflect the deduction of fees and expenses and are not available for direct investment.
Latest Economic News
Employment
There were 225,000 new jobs added in January after gaining 145,000 in December. Notable job gains in January occurred in construction, transportation, and health care. The unemployment rate inched up 0.01 percentage point to 3.6% for the month as the number of unemployed persons rose by 140,000 to 5.9 million. In December, average hourly earnings for all employees rose by $0.07 to $28.44. Average hourly earnings increased by 3.1% over the last 12 months ended in January. The average workweek was unchanged at 34.3 hours in January. The labor participation rate for January was 63.4% (63.2% in December), while the employment-population ratio was 61.2% last month (61.0% in December).
FOMC / interest rates
The Federal Open Market Committee did not meet in February. The next time the Committee meets is mid-March. Following its latest meeting in January, the FOMC decided to maintain the target range for the federal funds rate at 1.50%-1.75%. The rate hasn’t changed since it was decreased last October.
GDP / budget
According to the second estimate for the fourth-quarter gross domestic product, the economy accelerated at an annualized rate of 2.1%, the same rate as in the third quarter. Consumer spending grew at a rate of 1.7% (3.2% in the third quarter), fixed investment fell 0.5% in the fourth quarter (-0.8% in the third quarter), and nonresidential fixed investment dropped 2.3% in the fourth quarter, the same rate as in the prior quarter. Consumer prices advanced at a rate of 1.3% in the fourth quarter, comparable to the third quarter (1.5%). The Treasury budget posted a deficit of $32.6 billion in January ($13.3 billion in December). Last January saw a budget surplus of $8.7 billion. Through the first four months of the 2020 fiscal year, the deficit sits at $389.2 billion, 25.4% greater than the deficit over the same period last fiscal year. Compared to the same period last year, government spending climbed 10.3%, far exceeding receipts, which rose 6.1%. Medicare expenditures jumped 23.3%, national defense outlays advanced 8.9%, and Social Security expenditures climbed 5.6%. On the income side of the ledger, income tax receipts are up 5.5% compared to the same four months last year, followed by employment and general retirement, which rose 5.7%.
Inflation / Consumer Spending
- According to the Personal Income and Outlays report for January, both pre- and post-tax personal income rose 0.6% for the month. Consumer spending also climbed 0.2% over December’s totals. Price inflation remained low, however, inching ahead 0.1% in January and 1.7% over the last 12 months. Consumer prices less food and energy also advanced 0.1% for the month and 1.6% since January 2018.
- The Consumer Price Index inched ahead 0.1% in January following a 0.2% bump in December. Year to date, consumer prices are up 2.5%. Increases in prices for shelter (which makes up the largest portion of overall consumer costs) climbed 0.3% in January. Energy prices, which increased 1.4% in December, receded 0.7% in January, reflecting a drop in gas prices.
- Prices producers receive for goods and services advanced 0.5% in January after edging up 0.2% in December. The index has increased by 2.1% since last January. Producer prices less foods, energy, and trade services rose 0.5% in January (0.2% in December). Since January 2019, prices less foods, energy, and trade services moved up 1.7%. A drop in energy prices was more than offset by an advance in services.
Housing
After climbing 3.6% in December, existing-home sales fell 1.3% in January. Year over year, existing-home sales are up 9.6% (10.8% for the 12 months ended in December). The median sales price for existing homes was $266,300 in January compared to $274,500 in December. Existing home prices were up 6.8% from January 2019. Total housing inventory at the end of January was 1.42 million, an increase from the December rate of 1.40 million units for sale. Sales of new single-family homes spiked in January, climbing 7.9% over December’s totals. Sales are 18.6% above the January 2019 estimate. The median sales price of new houses sold in January was $348,200 ($324,100 in December). The average sales price was $402,300 in January ($373,300 in December). Available inventory, at a 5.1-month supply, was slightly lower than December’s 5.5-month supply.
Manufacturing
TFor the second consecutive month, industrial production declined, dropping 0.3% in January after falling 0.4% the prior month. Unseasonably warm weather held down the output of utilities and a major manufacturer significantly slowed production of civilian aircraft, both of which were prime factors in pushing industrial production downward. The index for manufacturing edged down 0.1% in January; excluding the production of aircraft and parts, factory output advanced 0.3%. The index for mining rose 1.2%. Following a spike in December, new orders for durable goods dropped 0.2% in January, declining for the second time over the last three months. For the year, new orders for durable goods are down 2.3%. Transportation equipment, down four of the last five months, drove the decrease, falling 2.2% in January. However, excluding transportation, new orders rose 0.9%. New orders for capital goods (manufactured assets used by businesses to produce consumer goods) jumped ahead 12.4% in January following a 6.2% tumble in December.
Imports and exports
- Import prices were unchanged in January after increasing 0.3% in December. In January, falling fuel prices offset increasing prices for nonfuel imports. Import prices advanced on a 12-month basis for the second consecutive month after not recording an over-the-year increase since the 12-month period ended in March 2019. Prices for import fuel declined 2.2% last month, marking the largest drop since fuel prices fell 4.2% in August. Excluding fuel, import prices rose 0.2% in January but are down 0.9% over the past year. Prices for exports advanced 0.7% in January, the largest monthly advance since export prices increased 0.7% in March. Prices for exports also advanced on a 12-month basis, increasing 0.5% in January. The rise in January was the first 12-month advance since export prices increased 0.2% for the year ended in April.
- The international trade in goods deficit was $65.5 billion in January, down from the $68.7 billion in December. Exports of goods for January fell 1.0% to $135.7 billion, $1.4 billion less than December exports. Imports of goods dropped 2.2% to $201.2 billion, $4.6 billion less than December imports.
- The latest information on international trade in goods and services, out February 5, is for December and shows that the goods and services trade deficit widened from $43.7 billion in November to $48.9 billion. December exports were $209.6 billion, $1.6 billion more than November exports. December imports were $258.5 billion, $6.8 billion more than November imports. The December increase in the goods and services deficit reflected an increase in the goods deficit of $5.1 billion and a decrease in the services surplus of $0.1 billion. For 2019, the goods and services deficit decreased to $10.9 billion, or 1.7%, from 2018. Exports decreased to $1.5 billion, or 0.1%. Imports decreased to $12.5 billion, or 0.4%.
International markets
Growing concerns over the spread of the coronavirus have rattled investors at home and abroad. European stock markets plunged on fears of negative economic impacts. Europe has seen outbreaks of the illness in Italy, Germany, France, Spain, and Great Britain. South Korea and Iran experienced a growing number of cases. Benchmark indexes such as the STOXX Europe 600, FTSE 100, and the DAX Performance Index (Germany’s benchmark index) have fallen noticeably since the end of January. Purchasing managers from several countries’ industries are warning of a slowdown in manufacturing. Japan’s gross domestic product showed that the economy contracted in the fourth quarter of 2019, with declines in consumer spending and investment. China’s GDP expanded at a rate of 6.0% in the fourth quarter and 6.1% for 2019 — the lowest figures in 29 years.
Consumer Confidence
The Conference Board Consumer Confidence Index® increased slightly in February following a moderate increase in January. The Present Situation Index — based on consumers’ assessment of current business and labor market conditions — decreased last month. However, the Expectations Index, which is based on consumers’ short-term outlook for income, business, and labor market conditions, increased in February.
Eye On The Month Ahead
There is still a lot of uncertainty about the actual impact of the coronavirus but we should start to receive economic data that will include the impact of this shock to the system. Once we have more clarity on the economic impact and also whether the virus is under control, the markets will react to actual facts as opposed to news headlines. March marks the first meeting of the Federal Open Market Committee since the end of January when interest rates were left unchanged at that time. The Fed has recently stated a willingness to cut rates if necessary due to the economic tumult caused by the coronavirus.
Due Date Approaches for 2019 Federal Income Tax Returns
Tax filing season is here again. If you haven’t done so already, you’ll want to start pulling things together — that includes getting your hands on a copy of your 2018 tax return and gathering W- 2s, 1099s, and deduction records. You’ll need these records whether you’re preparing your own return or paying someone else to prepare your tax return for you.
Don’t procrastinate
The filing deadline for individuals is generally Wednesday, April 15, 2020.
Filing for an extension
If you don’t think you’re going to be able to file your federal income tax return by the due date, you can file for and obtain an extension using IRS Form 4868, Application for Automatic Extension of Time to File U.S. Individual Income Tax Return. Filing this extension gives you an additional six months (to October 15, 2020) to file your federal income tax return. You can also file for an extension electronically — instructions on how to do so can be found in the Form 4868 instructions. Filing for an automatic extension does not provide any additional time to pay your tax. When you file for an extension, you have to estimate the amount of tax you will owe and pay this amount by the April filing due date. If you don’t pay the amount you’ve estimated, you may owe interest and penalties. In fact, if the IRS believes that your estimate was not reasonable, it may void your extension. Special rules apply if you’re living outside the country or serving in the military and on duty outside the United States. In these circumstances, you are generally allowed an automatic twomonth extension (to June 15, 2020) without filing Form 4868, though interest will be owed on any taxes due that are paid after the April filing due date. If you served in a combat zone or qualified hazardous duty area, you may be eligible for a longer extension of time to file.
What if you owe?
One of the biggest mistakes you can make is not filing your return because you owe money. If your return shows a balance due, file and pay the amount due in full by the due date if possible. If there’s no way that you can pay what you owe, file the return and pay as much as you can afford. You’ll owe interest and possibly penalties on the unpaid tax, but you’ll limit the penalties assessed by filing your return on time, and you may be able to work with the IRS to pay the remaining balance (options can include paying the unpaid balance in installments).
Expecting a refund?
The IRS is stepping up efforts to combat identity theft and tax refund fraud. New, more aggressive filters that are intended to curtail fraudulent refunds may inadvertently delay some legitimate refund requests. In fact, the IRS is now required to hold refunds on all tax returns claiming the earned income tax credit or the additional child tax credit until at least February 15. Most filers, though, can expect a refund check to be issued within 21 days of the IRS receiving a tax return.
Key May Dates / Data Releases
3/2: Markit PMI Manufacturing Index, ISM Manufacturing Index
3/4: ISM Non-Manufacturing Index 3/6: Employment situation, international trade in goods and services
3/11: Consumer Price Index, Treasury budget
3/12: Producer Price Index 3/13: Import and export prices
3/17: Retail sales, JOLTS, industrial production
3/18: Housing starts, FOMC statement
3/20: Existing home sales 3/24: New home sales
3/25: Durable goods orders
3/26: GDP, international trade in goods
3/27: Personal income and outlays
Monitoring Your Portfolio
You probably already know you need to monitor your investment portfolio and update it periodically. Even if you’ve chosen an asset allocation, market forces may quickly begin to tweak it. For example, if stock prices go up, you may eventually find yourself with a greater percentage of stocks in your portfolio than you want. If stock prices go down, you might worry that you won’t be able to reach your financial goals. The same is true for bonds and other investments.
Do you have a strategy for dealing with those changes? If you are a Premier Wealth Advisors – Managed Solutions client, you definitely do. If you are not, then you’ll probably want to take a look at your individual investments and while you are at it, you’ll also want to think about your asset allocation. Just like your initial investment strategy, your game plan for fine-tuning your portfolio periodically should reflect your investing personality, changes that have occurred in your life that may impact your financial priorities, as well as the market and economic environment.
The simplest choice is to set it and forget it — to make no changes. If you’ve allocated wisely and chosen good investments, you could simply sit back and do nothing. But even if you’re happy with your overall returns and tell yourself, “if it’s not broken, don’t fix it,” remember that your circumstances will change over time. Those changes may affect how well your investments match your goals, especially if they’re unexpected. At a minimum, you should periodically review the reasons for your initial choices to make sure they’re still valid.
Even things out
To bring your asset allocation back to the original percentages you set for each type of investment, you’ll need to do something that may feel counterintuitive: sell some of what’s working well and use that money to buy investments in other sectors that now represent less of your portfolio. Typically, you’d buy enough to bring your percentages back into alignment. This keeps what’s called a “constant weighting” of the relative types of investments.
The Dow Jones Industrial Average (DJIA) is a price-weighted index composed of 30 widely traded blue-chip U.S. common stocks. The S&P 500 is a market-cap weighted index composed of the common stocks of 500 leading companies in leading industries of the U.S. economy. The NASDAQ Composite Index is a market-value weighted index of all common stocks listed on the NASDAQ stock exchange. The Russell 2000 is a market-cap weighted index composed of 2,000 U.S. small-cap common stocks. The Global Dow is an equally weighted index of 150 widely traded blue-chip common stocks worldwide. Market indices listed are unmanaged and are not available for direct investment.
All third-party materials are the responsibility of their respective authors, creators, and/or owners. First Allied is not responsible for third-party materials, and the information reflects the opinion of its authors, creators, and/or owners at the time of its issuance, which opinions and information are subject to change at any time without notice and without obligation of notification.
These materials were obtained from sources believed to be reliable and presented in good faith, nevertheless, First Allied has not independently verified the information contained therein, and does not guarantee its accuracy or completeness.
The information has no regard to the specific investment objectives, financial situation, or particular needs of any specific recipient, and is intended for informational purposes only and does not constitute a recommendation, or an offer, to buy or sell any securities or related financial instruments, nor is it intended to provide tax, legal or investment advice. We recommend that you procure financial and/or tax advice as to the implications (including tax) of investing in any of the companies mentioned.
PREMIER WEALTH ADVISORS
NEW YORK
1411 Broadway, 16th Floor
New York, NY 10018
(800) 499-4143
LONG ISLAND
626 RXR Plaza, 6th Floor
Uniondale, NY 11856
(516) 778-5822
All content on the Premier Wealth Advisors, LLC. websites are provided for informational purposes only and are deemed to be from reliable sources. However, no warranty, expressed or implied, is made regarding its presentation.
This content should not be viewed as a recommendation, offer, or solicitation by PWA to buy, sell, or hold any security or financial product, nor does it endorse any specific investment strategy. Past performance does not guarantee future results, and all investments carry the potential for loss.
PWA manages portfolios based on each client’s specific investment needs, as specified in a signed investment advisory agreement. As a result, each client’s portfolio reflects unique circumstances and investment outcomes. PWA’s outlook and strategies may change based on updated client information, or if material or significant shifts in economic and financial market conditions occur.
While PWA aims to add value in areas beyond investments, such as tax and estate planning, we do not claim to be income tax professionals or estate planning attorneys. You should consult your tax advisor and/or estate planning attorney for legal or accounting needs.
Advisory Services are offered through Premier Wealth Advisors, LLC. an SEC Registered Investment Adviser.