
2018 Third Quarter Perspective
As we enter the 4th quarter, the US equity markets are close to their recent all-time highs. Meanwhile, on the fixed income side, the bond market has been selling off, causing interest rates to spike up to levels not seen in several years. The rise in interest rates has been fast and furious over the past week, adding some additional fright to the often spooky month of October. Let’s not forget however that the rise in interest rates has long been expected and in my opinion, is way overdue and actually a good thing. We’ve had extremely low-interest rates and a relatively flat yield curve since the financial crisis of 2008. At PWA, we’ve been talking about and preparing for a normalization in the interest rate yield curve for years. Now that’s it’s finally happening, portfolio managers, institutions and investors need to adjust to this new reality. We believe that this adjustment will stoke some fear, as well as trigger asset allocation changes, all of which will most likely cause additional market volatility. This should and will pass once interest rates stabilize. We believe that economic fundamentals for a good fourth quarter remain intact but we will feel more confident once we get a view of how corporations fared during the 3rd quarter. We are only days away from the start of corporate earnings releases. Stay tuned.
All-Time Highs – the trade and inflation worries that seemed to weigh down the markets in the first half of the year have seemingly subsided, with the market now hitting all-time highs.1 We would argue that there was an interesting tug-of-war in the first quarter as the corporate tax cuts sent earnings soaring but stock prices remained volatile as a result perhaps of trade and global economic uncertainty. Now that the market has had time to price-in the true nature of the ‘trade war,’ some of those worries have subsided. However, every day seems to have a new development.
Oil Prices on the Rise – oil prices hit their highest close in nearly four years last week, climbing over $80 a barrel after OPEC members decided not to raise production. At the center of
New Tariffs Take Effect – last Monday, new tariffs went into effect that levy a 10% duty on $200 billion worth of Chinese goods. China responded immediately with a 10% tax on $60 billion of U.S. imports, which at this point means that virtually all U.S. imports to China are subject to a tax. The U.S. responded by ratcheting up the dispute even further, threatening an additional tariff on $257 billion of Chinese goods, which if implemented would essentially cover all $505 billion on U.S. imports from China. The U.S. has also indicated that the current 10% tariff rate could jump to 25% later in the year, which in our view would turn the trade dispute from a spat into a war. At 10%, we would argue that the costs can be absorbed by corporations and consumers without materially affecting behavior, but at 25% the story would arguably change.3
The world and the investment landscape has changed dramatically over the past 10 years and we believe it is very important for investors to adjust their investment strategies accordingly. What was smart 10 years ago, may not be so smart today! Is your portfolio positioned for today’s economic realities and your specific needs?
At PWA, we can help you with a complimentary Risk Analysis Review. We use sophisticated portfolio analytics tools that run stress tests on how a portfolio would have performed under several different economic and market scenarios. The more informed you are about risks and how your investments are positioned, the more you can relax, sleep well, and enjoy the things you love most.
Contact us at 800-499-4143 extension 3 or send an email to info@yourpremierwealth.com with any questions you may have.
Looking back at the market and economy during 2016, one word comes to mind—resilience! Despite numerous surprises and negative headlines, the equity markets could not be held back.
John L. Diaz, CFP® / President & Senior Wealth Strategist
3rd Quarter Market Review
July 1,
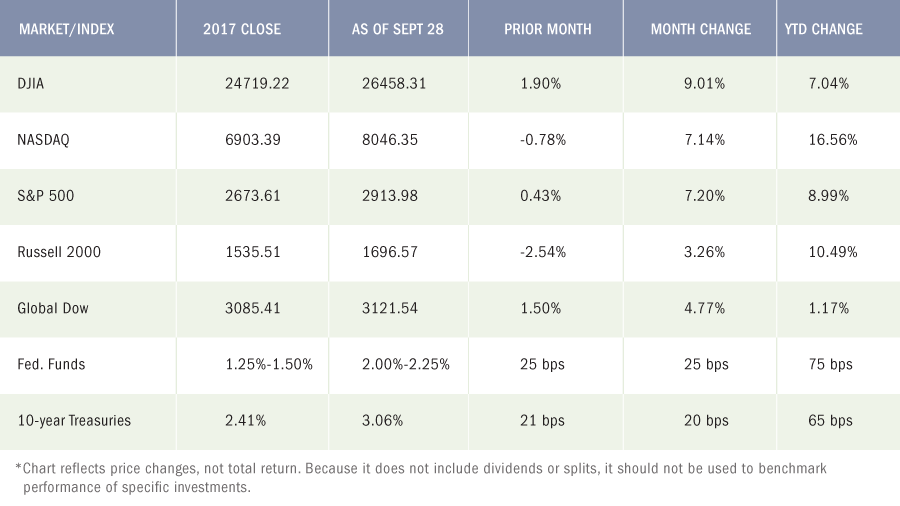
The third quarter proved to be very strong for domestic stocks. July saw the major benchmark indexes listed here enjoy robust gains, led by the large caps of the Dow and S&P 500. Global stocks also rebounded in July, with the Global Dow surging 3.76% by the end of July. Favorable economic indicators and encouraging corporate earnings reports were enough to quell investor concerns over the continuing saga that is the back-and-forth trade tariffs between the United States and China.
August saw stocks continue to push ahead. Several of the benchmark indexes listed here reached record highs during the month. Both the Dow and S&P 500 posted monthly gains of 2.16% and 3.03%, respectively. However, tech stocks and small caps made notable monthly gains. The Nasdaq increased by almost 6.0%, while the Russell 2000 eclipsed 4.0%. Corporate earnings continued to soar on the heels of corporate tax cuts, consumer spending, and global growth.
Toward the end of September, a new round of reciprocal tariffs between the United States and China kicked in as it appears neither economic giant is ready to flinch. The United States imposed an additional $200 billion in tariffs on Chinese goods, prompting China to assess $60 billion worth of tariffs on U.S. products. This follows each country’s initial volley of $50 billion in tariffs on their respective imports. As a result, the benchmark indexes listed here produced a mixed bag of returns for the month. The large caps of the Dow and S&P 500 posted gains, as did the Global Dow, which rose a strong 1.50% for September. However, the Nasdaq and the Russell 2000 fell from their August end-of-month values.
For the third quarter, each of the indexes listed here posted solid gains, led by the large caps of the Dow and the S&P 500. The tech-heavy Nasdaq continued its strong showing while the small caps of the Russell 2000 posted moderate quarterly gains. Prices for 10-year Treasuries dropped by the end of the quarter, pushing yields higher by 20 basis points. Crude oil prices closed the quarter at about $73.53 per barrel by the end of September, $0.72 per barrel lower than prices at the close of the second quarter. Gold closed the quarter at roughly $1,195.20, noticeably lower than its $1,254.20 price at the end of June. Regular gasoline, which was $2.833 on the 25th of June, inched higher to $2.844 on September 24.
September’s Economic News
Employment
Total employment rose by 201,000 in August after adding 147,000 (revised) new jobs in July. The average monthly gain over the last 12 months is 196,000. Notable employment gains for the month occurred in professional and business services (53,000), health care (33,000), and wholesale trade (22,000). The unemployment rate was unchanged for the month at 3.9% (4.4% in August 2017). The number of unemployed persons fell to 6.2 million (7.1 million unemployed in August 2017). The labor participation rate was relatively unchanged at 62.7%. The employment-population ratio
FOMC / interest rates
Total employment rose by 201,000 in August after adding 147,000 (revised) new jobs in July. The average monthly gain over the last 12 months is 196,000. Notable employment gains for the month occurred in professional and business services (53,000), health care (33,000), and wholesale trade (22,000). The unemployment rate was unchanged for the month at 3.9% (4.4% in August 2017). The number of unemployed persons fell to 6.2 million (7.1 million unemployed in August 2017). The labor participation rate was relatively unchanged at 62.7%. The employment-population ratio
GDP / budget
The second-quarter gross domestic product showed the economy expanded at an annualized rate of 4.2%, according to the Bureau of Economic Analysis. The first-quarter GDP grew at an annualized rate of 2.2%. According to the report, consumer spending surged, expanding at a rate of 3.8% (0.5% in the first quarter). Net exports expanded by 9.3%. Imports fell 0.6%, while government spending grew by 2.5% (1.5% in the first quarter). The government deficit sits at roughly $898 billion through August — an increase of almost $224 billion, or 33.3%, over the same period last fiscal year. The deficit increased by $137 billion in August over July. Through 11 months of the fiscal year, individual tax receipts are up 7.0% while corporate tax receipts are down 30.4%.
Inflation / Consumer Spending
Inflationary pressures have remained weak while consumer spending continues to be strong. Prices for consumer goods and services rose only 0.1% in August, the same mark reached in July. Core consumer prices, a tracker of inflationary trends, showed no increase following July’s 0.2% gain. Core prices (excluding food and energy) have increased by 2.0% over the last 12 months. Consumer spending climbed 0.3% in August after jumping 0.4% in July. Consumer income (pre-tax and after-tax) rose 0.3% for the month.
The Consumer Price Index rose 0.2% in August after increasing 0.2% in July. Over the last 12 months ended in August, consumer prices are up 2.7%. Core prices, which exclude food and energy, climbed 0.1% for the month and are up 2.2% over the 12 months ended in August.
According to the Producer Price Index, the prices companies receive for goods and services actually fell 0.1% in August after remaining unchanged in July from June. Producer prices have
Housing
New home sales rose 3.5% in August after falling 1.7% in July. Sales are up 12.7% over the August 2017 estimate. New home prices fell in August. The median sales price of new houses sold in August was $320,200 ($328,700 in July). The August average sales price was $388,400 ($389,000 in July). Inventory rose to an estimated 6.1-month supply, slightly behind July’s 6.2 months. Sales of existing homes didn’t expand in August, but they didn’t slow down either, as they maintained their pace set in July. Year-over-year, existing home sales are down 1.5%. The August median price for existing homes was $264,800, down from $269,600 in July. Nevertheless, prices are up 4.6% from August 2017. Total housing inventory for existing homes for sale in August remained unchanged from July, representing a 4.3-month supply at the current sales pace.
Manufacturing
Industrial production advanced 0.4% in August, its third consecutive monthly increase. For the year, industrial production has advanced 4.9%. Manufacturing output increased 0.2% following a 0.3% increase in July. The output of utilities moved up 1.2% on the heels of a marginal 0.1% bump in July. The index for mining gained 0.7%. New orders for long-lasting durable goods, up two of the past three months, grew a robust 4.5% in August, following a 1.2% July decrease. Shipments jumped 0.8% and unfilled orders increased 0.9%, while inventories decreased by 0.4%.
Imports and exports
The advance report on international trade in goods revealed that the trade gap expanded in August by $3.8 billion, or nearly 5.0%, over July. The deficit for August was $75.8 billion compared with July’s deficit of $72.2 billion. August exports of goods fell 1.6%, while imports increased by 0.7%. Prices for imported goods fell 0.6% in August after dropping 0.1% in July. Export prices decreased 0.1% for the month. Over the last 12 months ended in August, import prices are up 3.7%, while export prices have advanced 3.6%.
International markets
Some global stocks have enjoyed a strong run of late. Japanese stocks have approached highs not seen since the early 1990s. Germany, France, and the United Kingdom all saw gains in their respective stock benchmarks. While stocks have flourished, tensions have risen between the United Kingdom and the European Union as they continue to hash out a Brexit deal. Throughout the past several months, the ever-escalating trade battle between the United States and China has weighed on investors around the globe. Toward the end of the month, Chinese stock benchmarks gained strength, possibly signaling investor apathy toward the potential impact of the trade war with the United States.
Consumer sentiment
Consumer confidence, as measured by The Conference Board Consumer Confidence Index®, soared in September, near an 18-year high. Consumer confidence in present economic conditions grew, as did consumer expectations for continued economic growth.
Eye On The Month Ahead
The summer months proved full of volatility for stocks, as investors were inundated with negative rhetoric between the United States and several of its trade partners. The last quarter of the year is expected to bring much of the same. The Federal Open Market Committee meets twice more, in early November and mid-December, with the likelihood of at least one more interest rate increase on tap. The economy enjoyed robust growth during the second quarter, according to the gross domestic product. Will growth approach 4.0% in the last quarter of the year? If consumer spending continues to expand as it did during the summer months, economic expansion could equal or surpass third-quarter growth rate.
Key October Dates / Data Releases
10/1: PMI Manufacturing Index, ISM Manufacturing Index
10/5: Employment situation, international trade
10/10: Producer Price Index
10/11: Consumer Price Index, Treasury budget
10/12: Import and export prices
10/15: Retail sales
10/16: JOLTS, industrial production
10/17: Housing starts
10/19: Existing home sales
10/24: New home sales, FOMC meeting
1 Google Finance, September 26, 2018
2 The Wall Street Journal, September 23, 2018, http://go.steadyinvestor.com/e/279272/ons-1537698598-mod-djem10point/3g69x/286188741
3 The Wall Street Journal, September 24, 2018, http://go.steadyinvestor.com/e/279272/ect-1537777015-mod-djem10point/3g69z/286188741
Data sources: Economic: Based on data from U.S. Bureau of Labor Statistics (unemployment, inflation); U.S. Department of Commerce (GDP, corporate profits, retail sales, housing); S&P/Case-Shiller 20-City Composite Index (home prices); Institute for Supply Management (manufacturing/services). Performance: Based on data reported in WSJ Market Data Center (indexes); U.S. Treasury (Treasury yields); U.S. Energy Information Administration/Bloomberg.com Market Data (oil spot price, WTI Cushing, OK); www.goldprice.org (spot gold/silver); Oanda/FX Street (currency exchange rates). All information is based on sources deemed reliable, but no warranty or guarantee is made as to its accuracy or completeness. Neither the information nor any opinion expressed herein constitutes a solicitation for the purchase or sale of any securities, and should not be relied on as financial advice. Past performance is no guarantee of future results. All investing involves risk, including the potential loss of principal, and there can be no guarantee that any investing strategy will be successful.
The Dow Jones Industrial Average (DJIA) is a price-weighted index composed of 30 widely traded blue-chip U.S. common stocks. The S&P 500 is a market-cap weighted index composed of the common stocks of 500 leading companies in leading industries of the U.S. economy. The NASDAQ Composite Index is a market-value weighted index of all common stocks listed on the NASDAQ stock exchange. The Russell 2000 is a market-cap weighted index composed of 2,000 U.S. small-cap common stocks. The Global Dow is an equally weighted index of 150 widely traded blue-chip common stocks worldwide. Market indices listed are unmanaged and are not available for direct investment.
All third-party materials are the responsibility of their respective authors, creators, and/or owners. First Allied is not responsible for third-party materials, and the information reflects the opinion of its authors, creators, and/or owners at the time of its issuance, which opinions and information are subject to change at any time without notice and without obligation of notification.
These materials were obtained from sources believed to be reliable and presented in good faith, nevertheless, First Allied has not independently verified the information contained therein, and does not guarantee its accuracy or completeness.
The information has no regard to the specific investment objectives, financial situation, or particular needs of any specific recipient, and is intended for informational purposes only and does not constitute a recommendation, or an offer, to buy or sell any securities or related financial instruments, nor is it intended to provide tax, legal or investment advice. We recommend that you procure financial and/or tax advice as to the implications (including tax) of investing in any of the companies mentioned.
Securities offered through: First Allied Securities, Inc. Member: FINRA / SIPC
Advisory Services offered through: Premier Wealth Advisors, LLC. (PWA) & First Allied Advisory Services, Inc. (FAAS). PWA & FAAS are not affiliated entities.
This communication is strictly intended for individuals residing in the state(s) of AZ, CA, CT, DC, FL, GA, IL, MD, MA, NJ, NY, NC, PA, SC and VA. No offers may be made or accepted from any resident outside the specific states referenced.
PREMIER WEALTH ADVISORS
NEW YORK
1411 Broadway, 16th Floor
New York, NY 10018
(800) 499-4143
LONG ISLAND
626 RXR Plaza, 6th Floor
Uniondale, NY 11856
(516) 778-5822
All content on the Premier Wealth Advisors, LLC. websites are provided for informational purposes only and are deemed to be from reliable sources. However, no warranty, expressed or implied, is made regarding its presentation.
This content should not be viewed as a recommendation, offer, or solicitation by PWA to buy, sell, or hold any security or financial product, nor does it endorse any specific investment strategy. Past performance does not guarantee future results, and all investments carry the potential for loss.
PWA manages portfolios based on each client’s specific investment needs, as specified in a signed investment advisory agreement. As a result, each client’s portfolio reflects unique circumstances and investment outcomes. PWA’s outlook and strategies may change based on updated client information, or if material or significant shifts in economic and financial market conditions occur.
While PWA aims to add value in areas beyond investments, such as tax and estate planning, we do not claim to be income tax professionals or estate planning attorneys. You should consult your tax advisor and/or estate planning attorney for legal or accounting needs.
Advisory Services are offered through Premier Wealth Advisors, LLC. an SEC Registered Investment Adviser.