
2019 Second Quarter Perspective
New All-Time Highs
Since the start of 2019, equity markets have been on a relentless run, posting one all-time high after another. As April came to a close, each of the benchmark indexes listed in the charts below posted strong monthly returns. In fact, for several of the indexes, January to April 2019 was the best four-month stretch in many years.
Both the Nasdaq and S&P 500 reached new highs during the month, as investors were encouraged by a shrinking trade deficit, favorable economic projections, low inflation, and stable interest rates. The Nasdaq led the way, nearing a monthly gain of almost 5.0%, followed by the large caps of the S&P 500, the small caps of the Russell 2000, the Global Dow, and the Dow, which gained over 2.5% for the month. During April, consumers saw gas prices climb as oil prices continued to soar.
By the close of trading on April 30, the price of crude oil (WTI) was $63.42 per barrel, up from the March 29 price of $60.19 per barrel. The national average retail regular gasoline price was $2.887 per gallon on April 29, up from the March 25 selling price of $2.623, and $0.041 more than a year ago. The price of gold dipped by the end of April, falling to $1,285.10 by close of business on the 30th, down from $1,325.70 at the end of March.
Economic Fundamentals Remain Encouraging
On Friday, the U.S. Commerce Department reported first-quarter GDP growth and it was a pleasant surprise, up 3.2% compared to expectations of around 2.3%. Going into the second quarter, company earnings were expected to decline by 4% due to slower global growth and the rolling off from the tax reform boost that companies benefited from in 2018. With about 250 companies of the S&P 500 having reported thus far, results have been better than expected. The combination of a ‘not as bad as feared’ earnings season and a Fed that seems to be out of the way for the foreseeable future, has helped power the market’s sharp recovery from last year’s fourth quarter selloff.
We remain concerned, however, about the combination of investor complacency and current valuations in the stock market. We believe the markets are now priced for perfection and given the extent of the rise over these past few months, a pullback or correction would not surprise us. We believe a degree of caution is prudent.
We believe markets are now priced for perfection. Given the extent of the rise over these past few months, a pullback or correction would not surprise us—a degree of caution is prudent.
A Look at the Numbers
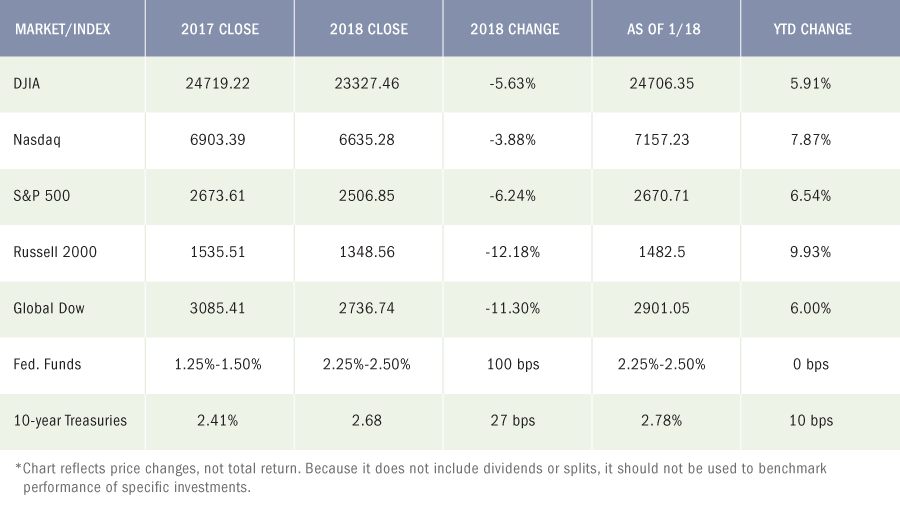
Snapshot 2018 The Markets
Employment
Total employment rose by 196,000 in March after adding only 33,000 (revised) in February. The average monthly job gain in the first quarter of 2019 was 180,000 per month (223,000 in 2018). Notable employment increases for March occurred in health care (49,000), professional and technical services (34,000), and food services and drinking places (27,000). The unemployment rate remained at 3.8% in March, and the number of unemployed persons also was effectively unchanged at approximately 6.2 million. The labor participation rate dropped 0.2 percentage point to 63.0% in March, while the employment-population ratio fell 0.1 percentage point to 60.6%. The average workweek increased by 0.1 hour to 34.5 hours for March. Average hourly earnings increased by $0.04 to $27.70. Over the last 12 months ended in March, average hourly earnings have risen 3.2%.
FOMC / interest rates
The Federal Open Market Committee meets at the end of April, with its report issued on May 1. The results of that meeting will be covered in the next monthly report. However, based on prior statements from the FOMC, rates are not expected to increase at this time.
GDP / budget
The initial estimate of the first-quarter gross domestic product showed the economy grew at an annualized rate of 3.2%. The GDP expanded at a rate of 2.2% for the fourth quarter of 2018. Driving the growth rate increase was a surge in business investment, growth in exports, and a decrease in imports. On the other hand, consumer spending, as measured by personal consumption expenditures, rose 1.2% — notably down from the fourth-quarter rate of 2.5%. Also of note, business investment increased 2.7% and government purchases were a strong 2.4%. The federal budget deficit was $147 billion in March ($234 billion in February) and sits at $691 billion through the first six months of the fiscal year. Over the same period for the fiscal year 2018, the deficit was $600 billion.
Inflation / Consumer Spending
The report on personal income and outlays is one that is favored by the Federal Reserve as an inflation indicator. The prices consumers paid for goods and services climbed 0.2% in March following a 0.1% gain in February. Excluding food and energy, consumer prices were unchanged in March after nudging up 0.1% the prior month. In March, consumer spending rose 0.9% (0.1% in February). Personal income inched up 0.1% in March after increasing 0.2% in February. Disposable (after-tax) income did not change in March after climbing 0.1% in February.
The Consumer Price Index increased 0.4% in March after rising 0.2% in February. Over the previous 12 months ended in March, the CPI rose 1.9%. The energy index increased by 3.5% in March, accounting for about 60% of the overall monthly increase. Core prices, which exclude food and energy, climbed 0.1% in March, the same increase as in February. Core prices were up 2.0% over the previous 12 months ended in March.
According to the Producer Price Index, the prices companies received for goods and services rose 0.6% in March after climbing 0.1% in February. The index increased 2.2% for the 12 months ended in March, the largest 12-month rise since a 2.5% advance in December 2018. Once again, soaring energy prices drove the PPI. Excluding food, energy, and trade services, producer prices were unchanged in March from February.
Housing
While new home sales have expanded, the market has been slower for existing home sales, which fell 4.9% in March after climbing 11.8% in February. Year-over-year, existing home sales remain down 5.4%. The March median price for existing homes was $259,400, up from $249,500 the prior month. Existing home prices were up 3.8% from March 2018. Total housing inventory for existing homes for sale in March increased to 1.68 million (3.9-month supply), up from 1.63 million existing homes available for sale in February. Sales of new homes continued to expand in March following a robust February. Sales of new single-family houses in March were 4.5% higher than in February, and 3.0% above the March 2018 estimate. Falling prices and a few more houses on the market have helped drive sales activity. The median sales price of new houses sold in March was $302,700 ($315,200 in February). The average sales price was $376,000 ($385,300 in February). Inventory was at a supply of 6.0 months in March (6.1 months in February).
Manufacturing
The manufacturing sector continues to sputter in March, as industrial production edged down 0.1% after inching up 0.1% in February. Manufacturing production was unchanged in March after declining in both January and February. Total industrial production was 2.8% higher in March than it was a year earlier. On a more positive note, durable goods orders increased by 2.7% in March after falling 1.1% (revised) in February. Soaring commercial aircraft and motor vehicle orders drove much of the March gain. New orders for durable goods excluding transportation increased by 0.4% in March.
Imports and exports
The latest information on international trade in goods and services, out April 17, is for February and shows that the trade deficit continues to shrink. For February, the goods and services deficit was $49.4 billion, down $1.8 billion from January’s figures, which were $8.8 billion lower than the prior month. February exports were up 1.1%, while imports rose by only 0.2%.
International markets
Canada’s GDP fell 0.1% in February from the previous month and is up 1.1% since February 2018. In light of this news, it is expected that the Bank of Canada will keep interest rates at their current level for what could be an extended period of time. Business surveys in China were not as positive as hoped for last month. Despite Beijing’s efforts to stimulate economic growth, manufacturing growth has been slower than anticipated. Eurozone inflation has been subdued for quite some time. However, Germany’s annual inflation rate, which grew to 2.1% in April, exceeded the European Central Bank’s target level. British Prime Minister Theresa May’s attempts to negotiate a Brexit deal with the Labour Party has not been fruitful so far. Presuming a stalemate with no internal agreement in place, Britain is likely to take part in next month’s European elections.
Consumer Confidence
The Conference Board Consumer Confidence Index® jumped from 124.2 in March to 129.2 in April. Consumers’ opinion of current economic conditions improved in April, as did their short-term outlook. Overall, consumers expect the economy to continue to grow at a solid pace into the summer months.
Eye On The Month Ahead
The economy grew at a rate exceeding 3.0% in the first quarter, according to the initial estimate of the GDP. May’s GDP report will have more complete information and may show that growth wasn’t quite so robust, as consumer spending appears to be slowing. Nevertheless, the stock market could get a boost if exports continue to outpace imports and progress is made toward a trade resolution with China. Looking ahead, investors may see the Fed hike interest rates if the economy picks up steam.
Key May Dates / Data Releases
5/1: FOMC meeting results, PMI Manufacturing Index, ISM Manufacturing Index
5/3: Employment situation, international trade in goods, ISM Non-Manufacturing Index
5/7: JOLTS
5/9: International trade, Producer Price Index
5/10: Consumer Price Index, Treasury budget
5/14: Import and export prices
5/15: Retail sales, industrial production
5/16: Housing starts
5/21: Existing home sales
5/23: New home sales
5/24: Durable goods orders
5/30: GDP, international trade in goods
5/31: Personal income and outlays
Monitoring Your Portfolio
You probably already know you need to monitor your investment portfolio and update it periodically. Even if you’ve chosen an asset allocation, market forces may quickly begin to tweak it. For example, if stock prices go up, you may eventually find yourself with a greater percentage of stocks in your portfolio than you want. If stock prices go down, you might worry that you won’t be able to reach your financial goals. The same is true for bonds and other investments.
Do you have a strategy for dealing with those changes? If you are a Premier Wealth Advisors – Managed Solutions client, you definitely do. If you are not, then you’ll probably want to take a look at your individual investments and while you are at it, you’ll also want to think about your asset allocation. Just like your initial investment strategy, your game plan for fine-tuning your portfolio periodically should reflect your investing personality, changes that have occurred in your life that may impact your financial priorities, as well as the market and economic environment.
The simplest choice is to set it and forget it — to make no changes. If you’ve allocated wisely and chosen good investments, you could simply sit back and do nothing. But even if you’re happy with your overall returns and tell yourself, “if it’s not broken, don’t fix it,” remember that your circumstances will change over time. Those changes may affect how well your investments match your goals, especially if they’re unexpected. At a minimum, you should periodically review the reasons for your initial choices to make sure they’re still valid.
Even things out
To bring your asset allocation back to the original percentages you set for each type of investment, you’ll need to do something that may feel counterintuitive: sell some of what’s working well and use that money to buy investments in other sectors that now represent less of your portfolio. Typically, you’d buy enough to bring your percentages back into alignment. This keeps what’s called a “constant weighting” of the relative types of investments.
The Dow Jones Industrial Average (DJIA) is a price-weighted index composed of 30 widely traded blue-chip U.S. common stocks. The S&P 500 is a market-cap weighted index composed of the common stocks of 500 leading companies in leading industries of the U.S. economy. The NASDAQ Composite Index is a market-value weighted index of all common stocks listed on the NASDAQ stock exchange. The Russell 2000 is a market-cap weighted index composed of 2,000 U.S. small-cap common stocks. The Global Dow is an equally weighted index of 150 widely traded blue-chip common stocks worldwide. Market indices listed are unmanaged and are not available for direct investment.
All third-party materials are the responsibility of their respective authors, creators, and/or owners. First Allied is not responsible for third-party materials, and the information reflects the opinion of its authors, creators, and/or owners at the time of its issuance, which opinions and information are subject to change at any time without notice and without obligation of notification.
These materials were obtained from sources believed to be reliable and presented in good faith, nevertheless, First Allied has not independently verified the information contained therein, and does not guarantee its accuracy or completeness.
The information has no regard to the specific investment objectives, financial situation, or particular needs of any specific recipient, and is intended for informational purposes only and does not constitute a recommendation, or an offer, to buy or sell any securities or related financial instruments, nor is it intended to provide tax, legal or investment advice. We recommend that you procure financial and/or tax advice as to the implications (including tax) of investing in any of the companies mentioned.
PREMIER WEALTH ADVISORS
NEW YORK
1411 Broadway, 16th Floor
New York, NY 10018
(800) 499-4143
LONG ISLAND
626 RXR Plaza, 6th Floor
Uniondale, NY 11856
(516) 778-5822
All content on the Premier Wealth Advisors, LLC. websites are provided for informational purposes only and are deemed to be from reliable sources. However, no warranty, expressed or implied, is made regarding its presentation.
This content should not be viewed as a recommendation, offer, or solicitation by PWA to buy, sell, or hold any security or financial product, nor does it endorse any specific investment strategy. Past performance does not guarantee future results, and all investments carry the potential for loss.
PWA manages portfolios based on each client’s specific investment needs, as specified in a signed investment advisory agreement. As a result, each client’s portfolio reflects unique circumstances and investment outcomes. PWA’s outlook and strategies may change based on updated client information, or if material or significant shifts in economic and financial market conditions occur.
While PWA aims to add value in areas beyond investments, such as tax and estate planning, we do not claim to be income tax professionals or estate planning attorneys. You should consult your tax advisor and/or estate planning attorney for legal or accounting needs.
Advisory Services are offered through Premier Wealth Advisors, LLC. an SEC Registered Investment Adviser.