
May 2019 Perspective
Tariff Turmoil
The US and China trade rhetoric ramped up in May and the equity markets responded with sharp declines from the all-time highs they reached in April. Investors were hoping for a peaceful resolution to the trade dispute and they were sorely disappointed. Following a few quarters of relative calm, President Trump surprised the markets by accusing China of renegotiating portions of the trade deal and imposed a sharp increase in Chinese import tariffs.
While we believe the US-China trade dispute is a negative for overall investor sentiment and a potential drag to global growth, the US has enormous leverage with China, given our trade deficit with the country and the ability of firms to shift supply chains towards alternatives like Vietnam, Mexico, and India. It is our view that this is just a piece of a larger, long-term power struggle that encompasses issues such as intellectual property rights, technology transfer practices, and cybersecurity.
What has us more concerned is President Trump’s recent tariff threat towards Mexico. This new development adds tremendous uncertainty to an already jittery market and business environment. Using tariffs to achieve policy goals makes it much more difficult for international companies to run their businesses and plan-ahead. If the President imposes these tariffs on Mexico, who knows what can be next which is a scary thought. Markets hate uncertainty!
The Markets
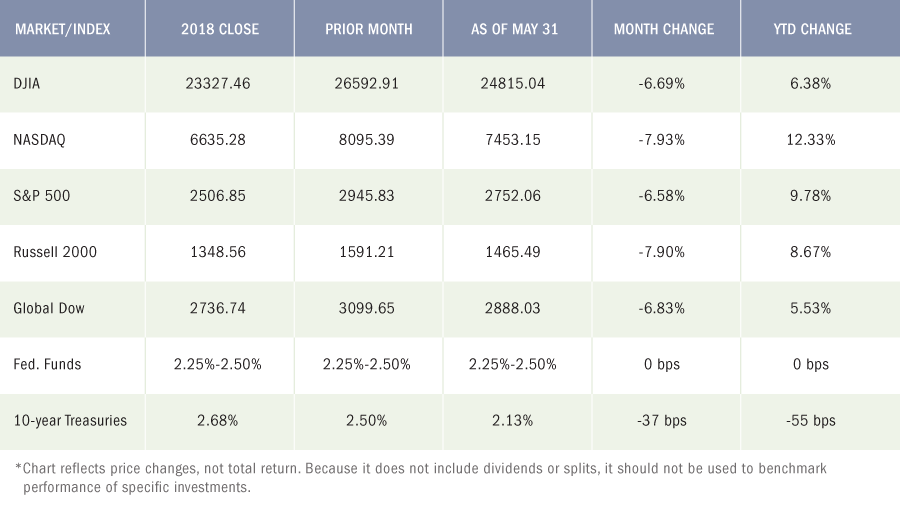
The escalating trade and political disputes helped to end the sharp market rally that began at the start of 2019, with May being the worst month since last December. Each of the benchmark indexes listed in the chart below, posted month-over-month losses in May exceeding 6.5%. Still, US stocks as measured by the S&P 500, remain higher by approximately 10% year to date. While market performance has largely swung on trade rhetoric, many investors reached their boiling point and moved away from stocks during the month, toward bonds, pushing yields on 10-year Treasuries down (-37 bps in May) as bond prices soared. Oil prices fell sharply on trade tensions and a slowing Chinese economy. For the month, small caps and tech stocks lost almost 8.0%, followed by the large caps of the Dow and the S&P 500. Year-to-date, only the Nasdaq remains more than 10% ahead of its 2018 closing value.
By the close of trading on May 31, the price of crude oil (WTI) was $53.33 per barrel, down from the April 30 price of $63.42 per barrel. The national average retail regular gasoline price was $2.822 per gallon on May 27, up from the April 29 selling price of $2.623, but $0.140 less than a year ago. The price of gold rose by the end of May, climbing to $1,310.30 by close of business on the 31st, up from its $1,285.10 price at the end of April.
Economic Fundamentals
Despite the market decline that took equities lower in May, the economic data remains broadly positive. Employment remains strong, consumer confidence beat expectations, and personal income and consumer spending both exceeded the estimates, while core inflation remains stable at 0.2%. By any measure other than fears of a trade-related global slowdown, the economy appears quite healthy. In addition, Federal Reserve Chair Jerome Powell said yesterday that the central bank will keep an eye on current developments in the economy and would do what it must to “sustain the expansion”. Many on wall street now believe that the Fed will cut rates three times within the next year which would certainly boost.
Investor Action Plan
Given the extent of the rally in US equities since the start of 2019, it was only a matter of time that we would experience profit taking and a potential correction—this is normal. When times are good, investors tend to think good times will go on forever; and when times are bad it can feel like the pain will never end. We believe the recent volatility will continue throughout the Summer. These are interesting times with potential headline risks that could spark buying and/or selling. As always, we want to emphasize the importance of aligning portfolio risk with specific liquidity and income needs, and investment time frame. Understand what you own and why you own it! Maintain diversification and don’t abandon a well thought out long-term investment strategy because of the daily ups and downs of the news cycle. Stay the course and stay invested!
At PWA, we can help you with a complimentary Risk Analysis Review. We use sophisticated portfolio analytics to run stress tests on portfolio allocations. We can then provide you with a report on how a portfolio may perform in different economic and market scenarios. The more informed you are about how your investments are positioned, the more you can relax, sleep well, and enjoy the things you love most.
Contact us at 800-499-4143 extension 3 or send an email to info@yourpremierwealth.com with any questions you may have.
Given the extent of the rally in US equities since the start of 2019, it was only a matter of time that we would experience profit taking and a potential correction—this is normal. When times are good, investors tend to think good times will go on forever; and when times are bad it can feel like the pain will never end.
A Look at the Numbers
May Economic News
Employment
Total employment vaulted by 263,000 in April after adding 189,000 (revised) new jobs in March. The average monthly job gain in 2019 was 213,000 per month (223,000 in 2018). Notable employment increases for April occurred in professional and business services (76,000), construction (33,000), and health care (27,000). The unemployment rate fell 0.2 percentage point to 3.6% in April, the lowest rate since December 1969. The number of unemployed persons decreased by 387,000 to 5.8 million. The labor participation rate dropped 0.2 percentage point for the second consecutive month to 62.8% in April, while the employment-population ratio was unchanged at 60.6%. The average workweek decreased by 0.1 hour to 34.4 hours for April. Average hourly earnings increased by $0.06 to $27.77. Over the last 12 months ended in April, average hourly earnings have risen 3.2%.
FOMC / interest rates
As expected, the Federal Open Market Committee did not change interest rates following its latest meeting during the first week of May. On the plus side, the Committee noted that economic activity was running at a solid rate, as was the labor market. However, household spending declined as did inflation, which was running below the FOMC’s 2.0% target rate.
GDP / budget
The second estimate of the first-quarter gross domestic product showed the economy grew at an annualized rate of 3.1% (3.2% for the initial estimate). The GDP expanded at a rate of 2.2% for the fourth quarter of 2018. Driving the growth rate increase was an upturn in state and local government spending, accelerations in private inventory investment and in exports, and a smaller decrease in residential investment. These movements were partly offset by decelerations in consumer spending and nonresidential fixed investment (business spending on equipment, structures, software, etc.), and a downturn in federal government spending. Imports declined. The federal budget enjoyed a surplus of $160.3 billion in April ($214.3 billion in April 2018), largely due to individual income tax payments. Through the first seven months of the fiscal year, the government deficit sits at $530.9 billion. Over the same period for fiscal year 2018, the deficit was $385.4 billion.
Inflation / Consumer Spending
Inflationary pressures remain weak as consumer prices are up 1.5% over the last 12 months ended in April. Consumer prices excluding food and energy are up 1.6% over the same 12-month period. For the month, consumer prices rose 0.3% over March, when prices increased by 0.2%. In April, consumer spending rose 0.3% (1.1% in March). Personal income climbed 0.5% in April after increasing 0.1% in March. Disposable (after-tax) income rose 0.4% in April after advancing 0.1% in March.
The Consumer Price Index increased 0.3% in April after rising 0.4% in March. Over the 12 months ended in April, the CPI rose 2.0%. The gasoline index continued to increase, rising 5.7% and accounting for over two-thirds of the monthly increase. Core prices, which exclude food and energy, climbed 0.1% for the third consecutive month in April. Core prices were up 2.1% over the previous 12 months ended in April.
According to the Producer Price Index, the prices companies received for goods and services rose 0.2% in April after climbing 0.6% in March. The index increased by 2.2% for the 12 months ended in April. The index fewer foods, energy, and trade services moved up 0.4% in April, the largest increase since rising 0.5% in January 2018.
Housing
While new home sales have continued to expand, the market has been slower for existing home sales, which fell 4.0% in April after dropping 4.9% in March. Year-over-year, existing home sales remain down 4.4%. The April median price for existing homes was $267,300, up from $259,400 the prior month. Existing home prices were up 3.6% from April 2018. Total housing inventory for existing homes for sale in April increased to 1.83 million (4.2-month supply), up from 1.67 million existing homes available for sale in March. Sales of new single-family houses in April were 6.9% lower than March, but 7% higher than their April 2018 estimate. Falling prices and a few more houses on the market have helped drive sales activity. The median sales price of new houses sold in April was $342,200. The average sales price was $393,700. Inventory was at a supply of 5.9 months in April.
Manufacturing
The manufacturing sector continued to sputter in April, as industrial production edged down 0.5% after falling 0.1% in March. Output is now reported to have declined 1.9% at an annual rate in the first quarter. Manufacturing production also decreased by 0.5% in April after being unchanged in March. Total industrial production was 0.9% higher in April than it was a year earlier. After showing signs of life during the first quarter, durable goods orders fell 2.1% in April after rising 1.7% (revised) in March. Transportation equipment drove the decrease, dropping 5.9% for the month.
Imports and exports
Import prices advanced 0.2% in April after increasing 0.6% in March. Higher fuel prices (+2.5%) drove the April increase. Excluding fuel, prices paid for imports edged down 0.1% in April. Prices received for exports also rose 0.2% in April following a 0.6% jump the prior month. Agricultural exports decreased by 1.5% in April, while nonagricultural export prices rose 0.4%. Prices for imports from China declined 0.2% in April, and have fallen 1.1% over the past 12 months—the largest over-the-year drop since the index fell 1.1% in May 2017. The latest information on international trade in goods and services, out May 9, is for March and shows that the goods and services deficit increased to $50.0 billion, up from the $49.3 billion deficit in February. March exports were $212.0 billion, $2.1 billion more than February exports. March imports were $262.0 billion, $2.8 billion more than February imports. Year-to-date, the goods and services deficit decreased $5.8 billion, or 3.7%, from the same period in 2018. The advance report on international trade in goods (excluding services) revealed the trade deficit to be $72.1 billion in April, up to $0.2 billion from March. Goods exports in April were $5.9 billion less than the prior month, while imports of goods were $6.5 billion less than March.
International markets
European Union elections held last week saw the highest turnout in 27 years and resulted in big wins for the Brexit Party and Liberal Democrats, and a devastating turn for Conservatives. Following Prime Minister Theresa May’s resignation announcement earlier in the week, the prospects of a negotiated Brexit deal are slim at best. As it stands, Great Britain will leave the European Union on October 31—deal or no deal—unless there’s another extension to negotiate a deal or Great Britain decides to forgo Brexit altogether. The trade dispute involving the United States and China continues to affect other nations, as Japan expects its industrial production to weaken, impacted by the trade tensions between the two world economic giants.
Consumer Confidence
The Conference Board Consumer Confidence Index® jumped from 129.2 in April to 134.1 in May, as consumers saw improvements in current business and labor market conditions.
Eye On The Month Ahead
The trade negotiations between the United States and China continue to play a major role in the domestic economy overall, and the stock market specifically. Industrial production fell in April, while sales of existing homes continued to flounder. Both sectors look to rebound heading into the summer months.
Key June Dates / Data Releases
6/3: PMI Manufacturing Index, ISM Manufacturing Index
6/5: ISM Non-Manufacturing Index
6/6: International trade
6/7: Employment situation
6/10: JOLTS
6/11: Producer Price Index
6/12: Consumer Price Index, Treasury budget
6/13: Import and export prices
6/14: Retail sales, industrial production
6/18: Housing starts
6/19: FOMC meeting
6/21: Existing home sales
6/25: New home sales
6/26: Durable goods orders, international trade in goods
6/27: GDP
6/28: Personal income and outlays
Monitoring Your Portfolio
You probably already know you need to monitor your investment portfolio and update it periodically. Even if you’ve chosen an asset allocation, market forces may quickly begin to tweak it. For example, if stock prices go up, you may eventually find yourself with a greater percentage of stocks in your portfolio than you want. If stock prices go down, you might worry that you won’t be able to reach your financial goals. The same is true for bonds and other investments.
Do you have a strategy for dealing with those changes? If you are a Premier Wealth Advisors – Managed Solutions client, you definitely do. If you are not, then you’ll probably want to take a look at your individual investments and while you are at it, you’ll also want to think about your asset allocation. Just like your initial investment strategy, your game plan for fine-tuning your portfolio periodically should reflect your investing personality, changes that have occurred in your life that may impact your financial priorities, as well as the market and economic environment.
The simplest choice is to set it and forget it — to make no changes. If you’ve allocated wisely and chosen good investments, you could simply sit back and do nothing. But even if you’re happy with your overall returns and tell yourself, “if it’s not broken, don’t fix it,” remember that your circumstances will change over time. Those changes may affect how well your investments match your goals, especially if they’re unexpected. At a minimum, you should periodically review the reasons for your initial choices to make sure they’re still valid.
Even things out
To bring your asset allocation back to the original percentages you set for each type of investment, you’ll need to do something that may feel counterintuitive: sell some of what’s working well and use that money to buy investments in other sectors that now represent less of your portfolio. Typically, you’d buy enough to bring your percentages back into alignment. This keeps what’s called a “constant weighting” of the relative types of investments.
The Dow Jones Industrial Average (DJIA) is a price-weighted index composed of 30 widely traded blue-chip U.S. common stocks. The S&P 500 is a market-cap weighted index composed of the common stocks of 500 leading companies in leading industries of the U.S. economy. The NASDAQ Composite Index is a market-value weighted index of all common stocks listed on the NASDAQ stock exchange. The Russell 2000 is a market-cap weighted index composed of 2,000 U.S. small-cap common stocks. The Global Dow is an equally weighted index of 150 widely traded blue-chip common stocks worldwide. Market indices listed are unmanaged and are not available for direct investment.
All third-party materials are the responsibility of their respective authors, creators, and/or owners. First Allied is not responsible for third-party materials, and the information reflects the opinion of its authors, creators, and/or owners at the time of its issuance, which opinions and information are subject to change at any time without notice and without obligation of notification.
These materials were obtained from sources believed to be reliable and presented in good faith, nevertheless, First Allied has not independently verified the information contained therein, and does not guarantee its accuracy or completeness.
The information has no regard to the specific investment objectives, financial situation, or particular needs of any specific recipient, and is intended for informational purposes only and does not constitute a recommendation, or an offer, to buy or sell any securities or related financial instruments, nor is it intended to provide tax, legal or investment advice. We recommend that you procure financial and/or tax advice as to the implications (including tax) of investing in any of the companies mentioned.
PREMIER WEALTH ADVISORS
NEW YORK
1411 Broadway, 16th Floor
New York, NY 10018
(800) 499-4143
LONG ISLAND
626 RXR Plaza, 6th Floor
Uniondale, NY 11856
(516) 778-5822
All content on the Premier Wealth Advisors, LLC. websites are provided for informational purposes only and are deemed to be from reliable sources. However, no warranty, expressed or implied, is made regarding its presentation.
This content should not be viewed as a recommendation, offer, or solicitation by PWA to buy, sell, or hold any security or financial product, nor does it endorse any specific investment strategy. Past performance does not guarantee future results, and all investments carry the potential for loss.
PWA manages portfolios based on each client’s specific investment needs, as specified in a signed investment advisory agreement. As a result, each client’s portfolio reflects unique circumstances and investment outcomes. PWA’s outlook and strategies may change based on updated client information, or if material or significant shifts in economic and financial market conditions occur.
While PWA aims to add value in areas beyond investments, such as tax and estate planning, we do not claim to be income tax professionals or estate planning attorneys. You should consult your tax advisor and/or estate planning attorney for legal or accounting needs.
Advisory Services are offered through Premier Wealth Advisors, LLC. an SEC Registered Investment Adviser.