
November 2019 Perspective
Market & Economic Outlook
As we look ahead to the closing months of 2019, we believe that many of the issues that created uncertainty and market volatility over the past year, continue to remain a concern. Regardless of these issues, the US stock market (as measured by the S&P 500 index) has been extremely resilient and hit a new all-time high in October. The positive momentum has been fueled by good corporate earnings results, stronger than expected US GDP growth, another interest rate cut by the Federal Reserve, and relatively positive reports on US-China trade negotiations.
Despite the good news on the equity markets, the US economy appears to be in a late-cycle stage and is showing early signs of slowing. Recent reports indicate that businesses remain hesitant to invest in equipment and software, exports are lagging in volume, and prices remain subdued. While GDP growth of 1.9% beat Wall Street expectations, it is still a decline from prior quarters, and this was the first sub-2% quarter for annualized US GDP growth since the first quarter of 2017. While the US consumer is still powering the economy, the recent data on business investment and manufacturing has clearly worsened and although the reading for October showed a slight improvement from September, it remains below 50 which means it is still contracting. It is important to mention that while the economy appears to be slowing, it is still growing, but at a slower pace. We still do not believe a recession is imminent over the next 18 months and if the US and China do resolve their trade dispute, that could provide a very nice boost to the global economy and potentially the markets. On the other hand, the longer the trade conflict remains unresolved, the more it will continue to damage the global economy.
What does all of this mean for investors?
Our expectations are for an increase in volatility over the near term and given current equity valuations and the strong rebound from late 2018, we believe it is prudent to adopt a more defensive posture to portfolio strategies. Please note that we are not recommending that investors deviate from their long-term strategic asset allocations. However, we do believe that now is a good time to rebalance portfolios and adjust equity strategies by allocating into the sectors, industries, and fundamental factors that could provide less volatility and possibly outperform in a late-stage cyclical economy. Historically, during a late-stage economic cycle, quality companies that can use their competitive advantages to drive profit growth regardless of economic conditions, have outperformed (Source: Blackrock). The fact is that most portfolios are built to navigate the waters that we’ve already crossed. If history has taught us anything, it’s that as time passes and the economy shifts, future market movements could be very different.
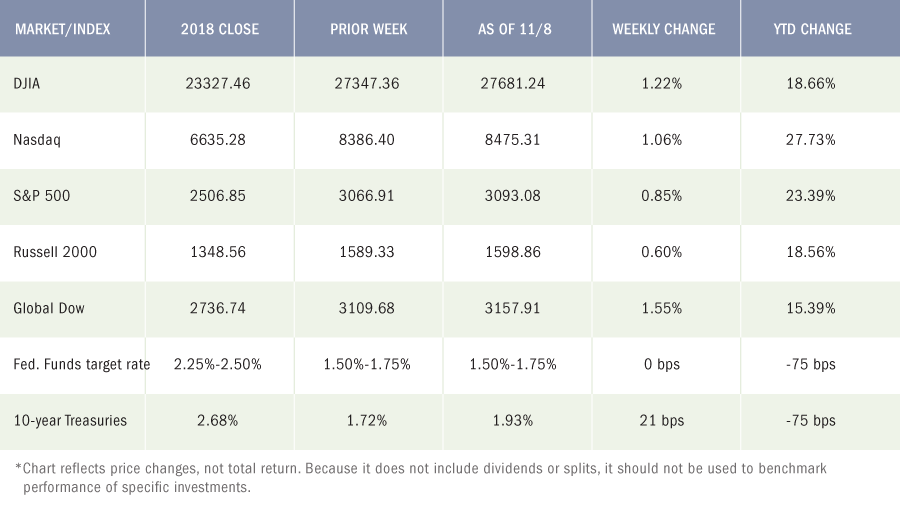
The Markets (as of market close November 8, 2019)
The Dow hit a new record high last week, and each of the benchmark indexes listed below posted solid gains as investors received encouraging news on the trade front. Both the United States and China sent signals out that an initial trade agreement would be signed in the near future, marking the first phase of the trade deal between the economic giants. As money flowed into stocks, long-term bond prices fell, pushing yields higher. For the week, the S&P 500 posted its fifth straight week of gains, while the Nasdaq advanced for the sixth consecutive week. The largest gainer last week was the Global Dow, which climbed over 1.50%.
Oil prices rose last week, closing at $57.39 per barrel by late Friday afternoon, up from the prior week’s price of $56.14. The price of gold (COMEX) fell for the first time in several weeks, closing at $1,459.20 by late Friday afternoon, down from the prior week’s price of $1,515.70. The national average retail regular gasoline price was $2.605 per gallon on November 4, 2019, $0.009 more than the prior week’s price but $0.148 less than a year ago.
Do you understand the risk in your Portfolio?
At PWA, we can help you with a complimentary Risk Analysis Review. We use sophisticated portfolio analytics to run stress tests on portfolio allocations. We can then provide you with a report on how a portfolio may perform in different economic and market scenarios. The more informed you are about how your investments are positioned, the more you can relax, sleep well, and enjoy the things you love most.
Contact us at 800-499-4143 extension 3 or send an email to info@yourpremierwealth.com with any questions you may have.
Our expectations are for an increase in volatility over the near term and given current equity valuations and the strong rebound from late 2018, we believe it is prudent to adopt a more defensive posture to portfolio strategies.
A Look at the Numbers
Autumn is in the air!

Economic News
Employment
There were 128,000 new jobs added in October, and the unemployment rate inched up one-tenth to 3.6%. Job growth has averaged 167,000 per month thus far in 2019. The number of unemployed persons also climbed marginally from 5.8 million in September to 5.9 million. The labor participation rate rose from 63.2% to 63.3% last month. The employment-population ratio held at 61.0%. Notable job gains in October occurred in food services and drinking places (48,000), social assistance (20,000), professional and business services (22,000), and financial activities (16,000). Indicative of the slowdown in manufacturing production, that sector declined by 36,000 jobs in October. The average workweek was unchanged at 34.4 hours in October. Average hourly earnings rose by $0.06 to $28.18. Over the past 12 months, average hourly earnings have increased by 3.0%.
FOMC / interest rates
The Federal Open Market Committee did not meet in August, after lowering interest rates by 25 basis points following its latest meeting in July. The Committee next meets in September. Due to mixed economic factors, it is unclear whether rates will remain as they are, or be reduced further.
GDP / budget
Economic growth appears to have slowed in the second quarter, according to the second estimate of the gross domestic product. The second quarter grew at an annualized rate of 2.0%. The first quarter saw an annualized growth of 3.1%. Consumer prices and spending increased in the second quarter, rising 2.2% and 4.7%, respectively. Pulling the GDP down in the second quarter were negative contributions from fixed business investment (equipment, software, structures, etc.) and exports. The federal budget deficit was $119.7 billion in July ($76.9 billion in July 2018). Through the first ten months of the fiscal year, the government deficit sits at $866.8 billion. Over the same period for fiscal year 2018, the deficit was $684.0 billion.
Inflation / Consumer Spending
Inflationary pressures remain weak as consumer prices rose 0.2% in August and are up 1.4% over the last 12 months ended in July. Consumer prices excluding food and energy increased 0.2% in July and 1.6% since July 2018. In July, consumer spending rose 0.6% (0.3% in June). Personal income and disposable (after-tax) personal income climbed 0.1% and 0.3%, respectively, in July.
The Consumer Price Index increased 0.3% in July following a 0.1% hop in June. Over the 12 months ended in July, the CPI rose 1.8%. Energy prices jumped 1.3% on the month with gasoline up 2.5%. Prices less food and energy rose 0.3% in July — the same increase as in June. Core prices (less food and energy) are up 2.2% over the last 12 months.
According to the Producer Price Index, the prices companies received for goods and services rose 0.2% in July after increasing 0.1% in June and 0.1% in May. The index increased by 1.7% for the 12 months ended in July. The price index less foods, energy, and trade services fell 0.1% in July after registering no change the prior month. The price index less foods, energy, and trade services increased by 1.7% over the last 12 months.
Housing
The housing sector has been anything but steady for much of the year, and September was no exception. Existing home sales plunged 2.2% in September following two consecutive monthly increases. Year-over-year, existing-home sales are up 3.9%. Existing home prices fell in September, as the median price for existing homes was $272,100, down from August’s median price of $278,200. Nevertheless, existing home prices were up 5.9% from September 2018. Total housing inventory for existing homes for sale in September decreased to 1.83 million (1.86 million in August), representing a 4.1-month supply at the current sales pace. After rising 6.1% in August, sales of new single-family houses tumbled 0.7% in September. However, new home sales are up 15.5% over their September 2018 estimate. The median sales price of new houses sold in September was $299,400 ($328,400 in August). The average sales price was $362,700 ($404,200 in August). Inventory at the end of September remained at a supply of 5.5 months.
Manufacturing
Manufacturing continued to lag in October, according to the latest Manufacturing ISM® Report On Business®. The purchasing managers’ index registered 48,3%, which, while better than September’s 47.8%, still represents contraction in the manufacturing sector (a reading below 50% constitutes contraction). Survey respondents noted an increase in new orders, up 1.8% at 49.1%, but still contracting. Production, supplier deliveries, and prices each fell in October and are all below 50.0%. Employment, inventories and new export orders increased, respectively.
Imports and exports
The international trade in goods (excluding services) deficit for September was $70.4 billion, down $2.7 billion from August. Exports of goods for September were $135.9 billion, $2.2 billion less than August exports. Imports of goods for September were $206.3 billion, $4.9 billion less than August imports. While the goods deficit shrank last month, both import and export trading contracted — evidence of a slowing global economy.
International markets
Still unable to reach an accord on a Brexit plan, the United Kingdom requested, and was granted, another extension by the European Union, this time to January 31. However, the UK could leave before that date if Parliament passes a withdrawal bill. UK stocks sank following news that the country was headed to yet another general election before the end of the year. In China, consumer prices rose 0.9% in September and are up 3.0% over the past 12 months — the highest level since 2013. Nevertheless, the Chinese economy continued to slow as its third-quarter gross domestic product expanded at a 6.0% year-over-year pace, down from the 6.2% rate of expansion in the second quarter.
Consumer Confidence
Consumer confidence remained tepid in October. The Conference Board Consumer Confidence Index® registered 125.9, down from 126.3 in September. The Present Situation Index — based on consumers’ assessment of current business and labor market conditions — increased from 170.6 to 172.3. The Expectations Index — based on consumers’ short-term outlook for income, business and labor market conditions — declined from 96.8 last month to 94.9 this month.
Eye On The Month Ahead
While stocks rebounded nicely last month, will that trend continue in November? Stock market growth seemingly rides on the progress made in the trade negotiations between the United States and China. With the impeachment process moving on to another phase and the government on target to shut down by the middle of November, it should be an interesting fourth quarter.
Year-End Investment and
Financial Planning Strategies to Consider
Just what you need, right? One more time-consuming task to be taken care of between now and the end of the year. But taking a little time out to make some strategic saving and investing decisions before December 31 can affect not only your long-term ability to meet your financial goals but also the amount of taxes you’ll owe next April.
Is time to rebalance your portfolio?
The first step in your year-end investment planning process should be a review of your overall portfolio. That review can tell you whether you need to rebalance your investment portfolio. If one type of investment has done well — for example, large-cap stocks — it might now represent a greater percentage of your portfolio than you originally intended, therefore increasing the overall risk. To rebalance, you would sell some of that asset class and use that money to buy other types of investments to bring your overall allocation back to an appropriate balance. Your overall review should also help you decide whether that rebalancing should be done before or after December 31 for tax reasons.
Also, make sure your asset allocation is still appropriate for your time horizon and goals. You might consider being a bit more aggressive if you’re not meeting your financial targets, or more conservative if you’re getting closer to retirement. If you want greater diversification, you might consider adding an asset class that tends to react to market conditions differently than your existing investments do. Or you might look into an investment that you have avoided in the past because of its high valuation if it’s now selling at a more attractive price. Diversification and asset allocation don’t guarantee a profit or ensure against a possible loss, of course, but they’re worth reviewing at least once a year.
Know when to hold ’em
When contemplating a change in your portfolio, don’t forget to consider how long you’ve owned each investment. Assets held for a year or less generate short-term capital gains, which are taxed as ordinary income. Depending on your tax bracket, your ordinary income tax rate could be much higher than the long-term capital gains rate, which applies to the sale of assets held for more than a year. For example, in 2019, the top marginal tax rate is 37%, which applies to any annual taxable income over $510,300 ($612,350 for married individuals filing jointly). By contrast, long-term capital gains are generally taxed at special capital gains tax rates of 0%, 15%, and 20% depending on your taxable income. (Long-term gains on collectibles are different; those are taxed at 28%.)
Your holding period can also affect the treatment of qualified stock dividends, which are taxed at the more favorable long-term capital gains rates. You must have held the stock at least 61 days within the 121-day period that starts 60 days before the stock’s ex-dividend date; preferred stock must be held for 91 days within a 181-day window. The lower rate also depends on when and whether your shares were hedged or optioned.
Make lemonade from lemons
Now is the time to consider the tax consequences of any capital gains or losses you’ve experienced this year. Though tax considerations shouldn’t be the primary driver of your investing decisions, there are steps you can take before the end of the year to minimize any tax impact of your investing decisions.
If you have realized capital gains from selling securities at a profit (congratulations!) and you have no tax losses carried forward from previous years, you can sell losing positions to avoid being taxed on some or all of those gains. Any losses over and above the amount of your gains can be used to offset up to $3,000 of ordinary income ($1,500 for a married person filing separately) or carried forward to reduce your taxes in future years. Selling losing positions for the tax benefit they will provide next April is a common financial practice known as “harvesting your losses.”
You sold stock in ABC company this year for $2,500 more than you paid when you bought it four years ago. You decide to sell the XYZ stock that you bought six years ago because it seems unlikely to regain the $20,000 you paid for it. You sell your XYZ shares at a $7,000 loss. You offset your $2,500 capital gain, offset $3,000 of ordinary income tax this year, and carry forward the remaining $1,500 to be applied in future tax years.
Make Sure to Avoid a “Wash Sale”
If you’re selling to harvest losses in a stock or mutual fund and intend to repurchase the same security, make sure you wait at least 31 days before buying it again. Otherwise, the trade is considered a “wash sale,” and the tax loss will be disallowed. The wash sale rule also applies if you buy an option on the stock, sell it short, or buy it through your spouse within 30 days before or after the sale.
If you have unrealized losses that you want to capture but still believe in a specific investment, there are a couple of strategies you might think about. If you want to sell but don’t want to be out of the market for even a short period, you could sell your position at a loss, then buy a similar exchange-traded fund (ETF) that invests in the same asset class or industry. Or you could double your holdings, then sell your original shares at a loss after 31 days. You’d end up with the same position but would have captured the tax loss.
If you’re buying a mutual fund or an ETF in a taxable account, find out when it will distribute any dividends or capital gains. Consider delaying your purchase until after that date, which often is near year-end. If you buy just before the distribution, you’ll owe taxes this year on that money, even if your own shares haven’t appreciated. And if you plan to sell a fund anyway, you may help reduce taxes by selling before the distribution date.
Before buying a mutual fund or ETF, don’t forget to consider carefully its investment objectives, risks, fees, and expenses, which can be found in the prospectus available from the fund. Read the prospectus carefully before investing.
The Dow Jones Industrial Average (DJIA) is a price-weighted index composed of 30 widely traded blue-chip U.S. common stocks. The S&P 500 is a market-cap weighted index composed of the common stocks of 500 leading companies in leading industries of the U.S. economy. The NASDAQ Composite Index is a market-value weighted index of all common stocks listed on the NASDAQ stock exchange. The Russell 2000 is a market-cap weighted index composed of 2,000 U.S. small-cap common stocks. The Global Dow is an equally weighted index of 150 widely traded blue-chip common stocks worldwide. Market indices listed are unmanaged and are not available for direct investment.
All third-party materials are the responsibility of their respective authors, creators, and/or owners. First Allied is not responsible for third-party materials, and the information reflects the opinion of its authors, creators, and/or owners at the time of its issuance, which opinions and information are subject to change at any time without notice and without obligation of notification.
These materials were obtained from sources believed to be reliable and presented in good faith, nevertheless, First Allied has not independently verified the information contained therein, and does not guarantee its accuracy or completeness.
The information has no regard to the specific investment objectives, financial situation, or particular needs of any specific recipient, and is intended for informational purposes only and does not constitute a recommendation, or an offer, to buy or sell any securities or related financial instruments, nor is it intended to provide tax, legal or investment advice. We recommend that you procure financial and/or tax advice as to the implications (including tax) of investing in any of the companies mentioned.
PREMIER WEALTH ADVISORS
NEW YORK
1411 Broadway, 16th Floor
New York, NY 10018
(800) 499-4143
LONG ISLAND
626 RXR Plaza, 6th Floor
Uniondale, NY 11856
(516) 778-5822
All content on the Premier Wealth Advisors, LLC. websites are provided for informational purposes only and are deemed to be from reliable sources. However, no warranty, expressed or implied, is made regarding its presentation.
This content should not be viewed as a recommendation, offer, or solicitation by PWA to buy, sell, or hold any security or financial product, nor does it endorse any specific investment strategy. Past performance does not guarantee future results, and all investments carry the potential for loss.
PWA manages portfolios based on each client’s specific investment needs, as specified in a signed investment advisory agreement. As a result, each client’s portfolio reflects unique circumstances and investment outcomes. PWA’s outlook and strategies may change based on updated client information, or if material or significant shifts in economic and financial market conditions occur.
While PWA aims to add value in areas beyond investments, such as tax and estate planning, we do not claim to be income tax professionals or estate planning attorneys. You should consult your tax advisor and/or estate planning attorney for legal or accounting needs.
Advisory Services are offered through Premier Wealth Advisors, LLC. an SEC Registered Investment Adviser.