
September 2019 Perspective
What the “Yield Curve Inversion” suggests about the economy
It’s been all over the news, the “yield curve” has inverted”, followed by “we are going into a recession….”
Over the past few weeks, we’ve had many calls about the yield curve, so I’d like to begin this month’s Perspective by providing a brief summary of what it is, what it means and why you should care.
On August 14, 2019, the Dow Jones Industrial Avenue plunged 800 points, losing 3% of its value in its biggest drop of the year. The Nasdaq Composite also lost 3%, while the S&P 500 lost 2.9%.
The slide started with bad economic news from Germany and China, which triggered a flight to the relative safety of U.S. Treasury securities. High demand briefly pushed the yield on the benchmark 10-year Treasury note below the two-year note for the first time since 2007.* This is referred to as a “yield curve inversion”, which has been a reliable predictor of past recessions. The media and market pundits were quick to frantically forecast the next recession. The short-lived inversion spooked the stock market, which then recovered, only to see the yield curve begin a series of inversions a week later.
From short to long
Yield relates to the return on capital that is invested in a bond. When bond prices rise due to increased demand, yields fall and vice versa. The yield curve is a graph with the daily yields of U.S. Treasury securities plotted by maturity. The slope of the curve represents the difference between yields on short-dated bonds and long-dated bonds. Normally, it curves upward as investors demand higher yields to compensate for the risk of lending money over a longer period. A ‘normal’ yield curve suggests that investors expect stronger growth in the future, with the prospect of rising inflation and higher interest rates.
The curve flattens when the rates converge because investors are willing to accept lower rates to keep their money invested in the relative safety of Treasuries for longer terms. A flat yield curve suggests that inflation and interest rates are expected to stay low for an extended period of time, signaling economic weakness.
Parts of the curve started inverting in late 2018, so the recent inversions were not completely unexpected. However, investors tend to focus on the spread between the broadly traded two-year and 10-year Treasury notes.*
Inversion as an economic indicator
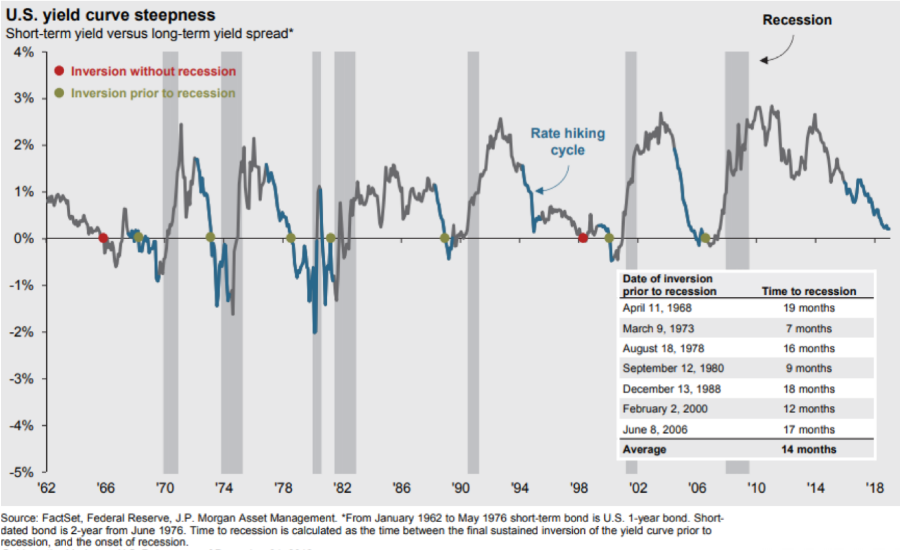
An inversion of the two-year and 10-year notes has occurred before each recession over the past 50 years, with only one “false positive” during that time span. It does not indicate timing or severity but has reliably predicted a recession within the next one to two years. A recent Federal Reserve study suggested that an inversion of the three-month and 10-year Treasuries — which occurred in March and May 2019 — is an even more reliable indicator, predicting a recession in about 12 months.*
The chart below shows the historic slope of the yield curve and the recessions that followed in gray. This chart illustrates that when the curve inverts, a recession is very likely to follow at some point.
Is it different this time?
An inverted yield curve is an indicator that economic strain is on the horizon. In fact, early signs of stress can already be seen in slower manufacturing activity, dissipating corporate confidence, worsening business profitability, and of course, escalating trade disputes. It is important to note however that in the past, there has been a significant lag between the first yield inversion date and the onset of a recession. The average lag time is 14 months which means, there is no immediate need to panic.
Some analysts believe that the yield curve may no longer be a reliable indicator due to the Federal Reserve’s unprecedented balance sheet of Treasury securities — originally built to increase the money supply as an antidote to the Great Recession. Although the Fed has trimmed the balance sheet, it continues to buy bonds in large quantities to replace maturing securities. This reduces the supply of Treasuries and increases pressure on yields when demand rises, as it has in recent months.
At the same time, the Fed has consistently raised its benchmark federal funds rate over the last three years in response to a stronger U.S. economy, while other central banks around the globe have kept their policy rates near or below zero in an effort to stimulate their sluggish economies. As a result, this has raised yields on short-term Treasuries, which are more directly affected by the funds rate, while global demand for longer-term Treasuries has increased, causing long term rates to drop. Even at these lower rates, U.S. Treasuries offer relatively safe yields that cannot be obtained elsewhere in the world.
The Fed lowered the federal funds rate by 0.25% in late July, the first drop in more than a decade. While this slightly reduced short-term Treasury yields, it contributed to the demand for long-term bonds as investors anticipated declining interest rates. When interest rates fall, prices on existing bonds rise and yields decline. So the potential for further action by the Fed led investors to lock in long-term yields at current prices.*
Economic headwinds
Even if these technical factors are distorting the yield curve, the high demand for longer-term Treasuries represents a flight to safety — a shift of investment dollars into low-risk government securities — and a pessimistic economic outlook. One day after the initial two-year/10-year inversion, the yield on the 30-year Treasury bond fell below 2% for the first time. This suggests that investors see decades of low inflation and tepid growth.
The flight to safety is being driven by many factors, including the U.S.-China trade war and a global economic slowdown. Five of the world’s largest economies — Germany, Britain, Italy, Brazil, and Mexico — are at risk of a recession and others are struggling.
Although the United States remains strong by comparison, there are concerns about weak business investment and a manufacturing slowdown, both weighed down by the uncertainty of the trade war and costs of the tariffs.* Inflation has been persistently low since the last recession, generally staying below the 2% rate that the Fed considers optimal for economic growth. On the positive side, unemployment remains low and consumer spending continues to drive the economy, but it remains to be seen how long consumers can carry the economic weight. Despite a resilient U.S. consumer, the market is increasingly expecting central banks to stabilize the downward shift in sentiment and economic activity.
The Markets in August
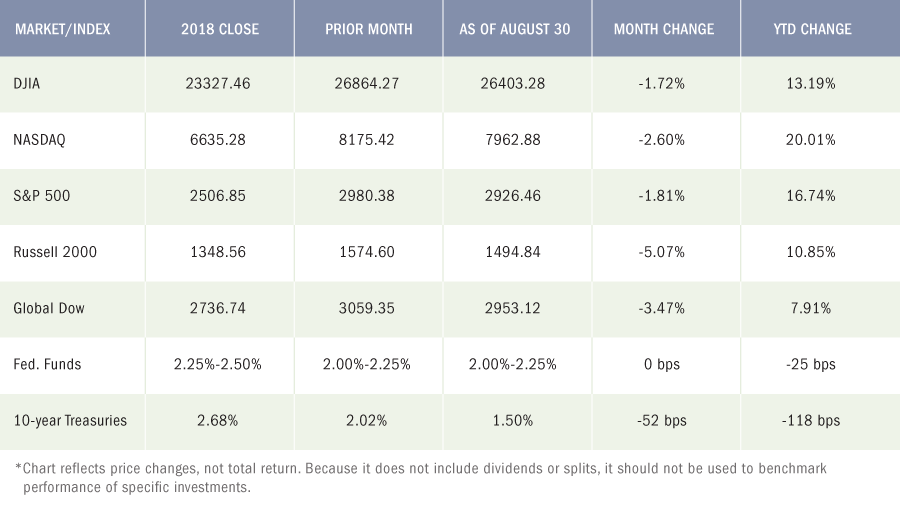
The fixed income bond markets stole the show as yields sharply and steadily fell all throughout the month. The yield on the US 10-Year Treasury note collapsed 52 basis points (one basis point is 0.01%), sinking from 2.02% to 1.51%.
Risk-off sentiment drove global equities down in a volatile as tit-for-tat tariffs were imposed b the U.S. and China. Despite an end of month push higher, August closed on a weak note for stocks, ending a tumultuous month marked by high volatility. Investors moved away from stocks, fearing that the ongoing U.S.-China trade war would negatively impact domestic and global economies. As a result, gold prices surged and long-term bond yields plummeted as prices rose. Despite the wide market swings, consumers spent more of their income as the job market remained strong.
By the close of trading on the last day of the month, each of the benchmark indexes listed here fell, with the small caps of the Russell 2000 being hit the hardest, followed by the Global Dow, the Nasdaq, the S&P 500, and the Dow, which lost over 1.70% from its July closing value. Year-to-date, each of the indexes remain ahead of their respective 2018 closing prices. However, compared to their values at the end of August 2018, the Dow and the S&P 500 are up 1.70% and 0.86%, respectively, while the Nasdaq (-1.80%), the Russell 2000 (-14.10%), and the Global Dow (-4.00%) have lost value.
By the close of trading on August 30, the price of crude oil (WTI) was $55.16 per barrel, down from the July 31 price of $57.88 per barrel. The national average retail regular gasoline price was $2.574 per gallon on August 26, down from the July 29 selling price of $2.715 and $0.253 less than a year ago. The price of gold rose by the end of August, climbing to $1,529.20 by close of business on the 30th, up from its $1,426.10 price at the end of July.
What Should Investors Do?
The U.S. and global equity markets have been in a sustained volatile patch since early summer, and if you look at the S&P 500 over the last year, all the ups and downs have actually netted flat returns*. Whether you want to blame the trade war, slowing corporate earnings growth, weakening China and European economic fundamentals, the inverted yield curve, or some combination of them all, stocks have been fighting an uphill battle.
As uncertainty grows over how much longer the global economic expansion can last, central banks and governments have been posturing to respond with fresh economic stimulus, rate cuts, or both. But at the same time, investors have been increasingly pouring into safer assets like U.S. Treasuries. For many, it easy to follow the crowd as some investors look at the broader picture and think, “Wouldn’t now be a good time to go to cash?” If the future is this uncertain and all the signs are pointing towards a recession and weak stock performance in the short-to-medium term, why not just shift to cash and wait until the economic outlook improves?
Trying to time the market and go to cash, in my view, is not the best option. Instead, I recommend having a plan that is in sync with your specific investment time frame and liquidity needs. I believe that as a general rule, a high allocation to cash over the long-term raises the risk that an investor will fall short of achieving their long term financial goals. The two exceptions to this rule, in my view, are (1) if a person has the cash earmarked for a short-term cash flow need, say in the next year or two; or, (2) if a person has sufficient wealth that they don’t need growth to meet their financial goals. Outside of these two exceptions, I think you should stay the course and plan to stay invested.
To see why timing the markets and avoiding risk by going to cash can be harmful, just look at what happens if an investor misses big up days in the market. The hypothetical table below looks at the performance of $10,000 invested in the S&P 500 between January 4, 1988 and December 31, 2018. It’s important to note that this $10,000 was exposed to two of the biggest bear markets in stock market history, the 2000 tech bubble crash and the 2008 global financial crisis.
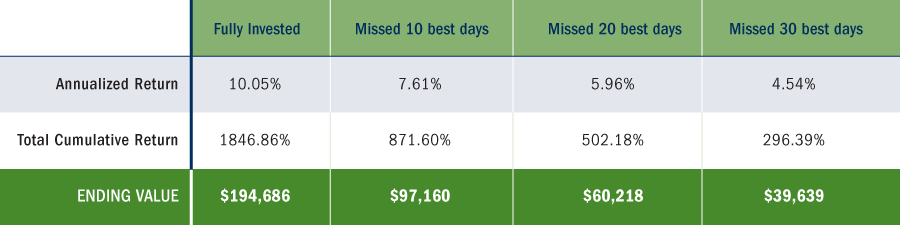
Even missing the 10 best days over that period meant leaving half of your potential total return on the table. It’s important to note that six of the 10 “best days” in the market occurred within just weeks of the worst days in the market. In other words, some of the best days often happen as “v-shaped” bounces just after the worst days. Selling and going to cash on a big negative day means increasing the risk of missing a big positive day, which as you can see from the table above, can have a significant impact on total return over time.
Bottom Line for Investors
Uncertainty and volatility in the equity markets are likely to persist for the balance of the year and beyond. But in my view, an investor’s response should not be to run for cover and go to cash. I firmly believe that doing so reduces your chances of reaching your long-term goals. Instead, if the uncertainty and volatility has you nervous, I would recommend revisiting your asset allocation, where you can control your risk by diversifying and allocating among different categories of equities and fixed income. A professional can help you determine the optimal balance for your specific situation.
At PWA, we can help you with a complimentary Risk Analysis Review. We use sophisticated portfolio analytics to run stress tests on portfolio allocations. We can then provide you with a report on how a portfolio may perform in different economic and market scenarios. The more informed you are about how your investments are positioned, the more you can relax, sleep well, and enjoy the things you love most.
Contact us at 800-499-4143 extension 3 or send an email to info@yourpremierwealth.com with any questions you may have.
It is important to note that there is a significant lag between the first yield inversion date and the onset of a recession. The average lag time is 14 months which means, there is no immediate need to panic.
A Look at the Numbers
Economic News
Employment
Total employment increased by 164,000 in July after adding 193,000 (revised) new jobs in June. The average monthly job gain so far in 2019 is roughly 164,000 per month (223,000 in 2018). Notable employment increases for June occurred in professional and business services (31,000), health care (30,000), and social assistance (20,000). The unemployment rate remained at 3.7% in July. The number of unemployed persons increased slightly to 6.1 million in July (6.0 million in June). The labor participation rate was 63.0% (62.9% in June) and the employment-population ratio was 60.7% (60.6% in June). The average workweek decreased 0.1 hour to 34.3 hours for July. Average hourly earnings increased by $0.08 to $27.98. Over the last 12 months ended in July, average hourly earnings have risen 3.2%.
FOMC / interest rates
The Federal Open Market Committee did not meet in August, after lowering interest rates by 25 basis points following its latest meeting in July. The Committee next meets in September. Due to mixed economic factors, it is unclear whether rates will remain as they are, or be reduced further.
GDP / budget
Economic growth appears to have slowed in the second quarter, according to the second estimate of the gross domestic product. The second quarter grew at an annualized rate of 2.0%. The first quarter saw an annualized growth of 3.1%. Consumer prices and spending increased in the second quarter, rising 2.2% and 4.7%, respectively. Pulling the GDP down in the second quarter were negative contributions from fixed business investment (equipment, software, structures, etc.) and exports. The federal budget deficit was $119.7 billion in July ($76.9 billion in July 2018). Through the first ten months of the fiscal year, the government deficit sits at $866.8 billion. Over the same period for fiscal year 2018, the deficit was $684.0 billion.
Inflation / Consumer Spending
Inflationary pressures remain weak as consumer prices rose 0.2% in August and are up 1.4% over the last 12 months ended in July. Consumer prices excluding food and energy increased 0.2% in July and 1.6% since July 2018. In July, consumer spending rose 0.6% (0.3% in June). Personal income and disposable (after-tax) personal income climbed 0.1% and 0.3%, respectively, in July.
The Consumer Price Index increased 0.3% in July following a 0.1% hop in June. Over the 12 months ended in July, the CPI rose 1.8%. Energy prices jumped 1.3% on the month with gasoline up 2.5%. Prices less food and energy rose 0.3% in July — the same increase as in June. Core prices (less food and energy) are up 2.2% over the last 12 months.
According to the Producer Price Index, the prices companies received for goods and services rose 0.2% in July after increasing 0.1% in June and 0.1% in May. The index increased by 1.7% for the 12 months ended in July. The price index less foods, energy, and trade services fell 0.1% in July after registering no change the prior month. The price index less foods, energy, and trade services increased by 1.7% over the last 12 months.
Housing
Activity in the housing market can be described as erratic at best. Existing home sales jumped 2.5% in July after falling 1.7% in June. Year-over-year, existing-home sales are up 0.6%. Existing home prices fell in July, as the median price for existing homes was $280,800 — off from June’s all-time high of $285,700. Nevertheless, existing home prices were up 4.3% from July 2018. Total housing inventory for existing homes for sale in July decreased to 1.89 million (1.93 million in June), representing a 4.2-month supply at the current sales pace. Sales of new single-family houses plummeted in July after surging the previous month. July’s new home sales fell 12.8%, down from June’s robust total. New home sales are still 4.3% ahead of their July 2018 estimate. The median sales price of new houses sold in July was $312,800 ($310,400 in June). The average sales price was $388,000 ($368,600 in June). Inventory at the end of July was at a supply of 6.4 months (6.3 months in June).
Manufacturing
According to the Federal Reserve, industrial production declined 0.2% in July after remaining unchanged in June. Manufacturing output decreased 0.4% in July and has fallen more than 1.5% since December 2018. In July, mining output fell 1.8%, while utilities rose 3.1%. Total industrial production was 0.5% higher in July than it was a year earlier. Orders for durable goods jumped 2.1% in July after increasing 2.0% the prior month. New orders for capital goods used by businesses to produce consumer goods surged 5.0% after rising 1.4% in June. Core capital goods (excluding defense and aircraft) increased by 0.4% in July.
Imports and exports
Import and export prices rebounded slightly in July from their June totals. Import prices rose 0.2% after falling 1.1% in June. Despite the July increase, import prices have decreased by 1.8% over the past 12 months. Import fuel prices rose 1.8% in July after a 7.3% drop in June. Excluding fuel, import prices fell 0.1% for the third consecutive month in July. Export prices jumped ahead 0.2% in July after decreasing 0.9% in June. Export prices have fallen 0.9% for the year ended in July. The latest information on international trade in goods and services, out August 2, is for June and shows that the goods and services deficit was $55.2 billion, down slightly from the revised $55.3 billion deficit in May. June exports were $206.3 billion, $4.4 billion less than May exports. June imports were $261.5 billion, $4.6 billion less than May imports. Year-to-date, the goods and services deficit increased $23.2 billion, or 7.9%. Exports increased by $0.5 billion, or less than 0.1%. Imports increased by $23.8 billion, or 1.5%. The advance report on international trade in goods (excluding services) revealed the trade deficit declined to $72.3 billion in July, down from $74.2 billion in June. Exports of goods in July were $137.3 billion, $0.9 billion more than June exports, while imports of goods were $209.7 billion, $0.9 billion less than June imports.
International markets
British Prime Minister Boris Johnson attempted to shut down Parliament for several weeks as part of his effort to shunt opponents to his plan to push through a “no-deal” Brexit on October 31. The move sent global stocks, government bond yields, and the pound reeling. In economic news, the German economy shrank 0.1% in the second quarter but is up 0.4% over the same period last year. Inflationary pressures continue to wane in Japan, as its Consumer Price Index inched up 0.1% in July, and is up only 0.5% year-over-year. In China, economic growth dipped to a 27-year low in the second quarter amid the trade war with the United States. As the rainforest fires raged in his country, Brazilian President Jair Bolsonaro refused to accept $20 million in aid from G7 countries stemming from a personal rift between Bolsonaro and French President Emmanuel Macron.
Consumer Confidence
Despite a plunging stock market in August, consumers were fairly upbeat in their assessment of the economy. The Conference Board Consumer Confidence Index® declined marginally in August following July’s robust numbers — falling to 135.1 from 135.8. Consumers’ assessment of current business and labor market conditions increased, although consumers’ short-term outlook for income, business, and labor market conditions were not quite so positive.
Autumn is in the air!

Eye On The Month Ahead
Corporate earnings released in August, coupled with the ongoing trade negotiations between the United States and China, are likely to continue to impact market activity. Short term Interest rates will remain unchanged until at least September when the Federal Open Market Committee next meets.
Key August Dates / Data Releases
9/3: Markit PMI Manufacturing Index, ISM Manufacturing Index
9/4: International trade
9/5: ISM Non-Manufacturing Index
9/6: Employment situation
9/10: JOLTS
9/11: Producer Price Index
9/12: Consumer Price Index, Treasury budget
9/13: Retail sales, import and export prices
9/17: Industrial production
9/18: Housing starts, FOMC statement
9/19: Existing home sales
9/25: New home sales
9/26: GDP, international trade in goods
9/27: Durable goods orders, personal income and outlays
The Dow Jones Industrial Average (DJIA) is a price-weighted index composed of 30 widely traded blue-chip U.S. common stocks. The S&P 500 is a market-cap weighted index composed of the common stocks of 500 leading companies in leading industries of the U.S. economy. The NASDAQ Composite Index is a market-value weighted index of all common stocks listed on the NASDAQ stock exchange. The Russell 2000 is a market-cap weighted index composed of 2,000 U.S. small-cap common stocks. The Global Dow is an equally weighted index of 150 widely traded blue-chip common stocks worldwide. Market indices listed are unmanaged and are not available for direct investment.
All third-party materials are the responsibility of their respective authors, creators, and/or owners. First Allied is not responsible for third-party materials, and the information reflects the opinion of its authors, creators, and/or owners at the time of its issuance, which opinions and information are subject to change at any time without notice and without obligation of notification.
These materials were obtained from sources believed to be reliable and presented in good faith, nevertheless, First Allied has not independently verified the information contained therein, and does not guarantee its accuracy or completeness.
The information has no regard to the specific investment objectives, financial situation, or particular needs of any specific recipient, and is intended for informational purposes only and does not constitute a recommendation, or an offer, to buy or sell any securities or related financial instruments, nor is it intended to provide tax, legal or investment advice. We recommend that you procure financial and/or tax advice as to the implications (including tax) of investing in any of the companies mentioned.
PREMIER WEALTH ADVISORS
NEW YORK
1411 Broadway, 16th Floor
New York, NY 10018
(800) 499-4143
LONG ISLAND
626 RXR Plaza, 6th Floor
Uniondale, NY 11856
(516) 778-5822
All content on the Premier Wealth Advisors, LLC. websites are provided for informational purposes only and are deemed to be from reliable sources. However, no warranty, expressed or implied, is made regarding its presentation.
This content should not be viewed as a recommendation, offer, or solicitation by PWA to buy, sell, or hold any security or financial product, nor does it endorse any specific investment strategy. Past performance does not guarantee future results, and all investments carry the potential for loss.
PWA manages portfolios based on each client’s specific investment needs, as specified in a signed investment advisory agreement. As a result, each client’s portfolio reflects unique circumstances and investment outcomes. PWA’s outlook and strategies may change based on updated client information, or if material or significant shifts in economic and financial market conditions occur.
While PWA aims to add value in areas beyond investments, such as tax and estate planning, we do not claim to be income tax professionals or estate planning attorneys. You should consult your tax advisor and/or estate planning attorney for legal or accounting needs.
Advisory Services are offered through Premier Wealth Advisors, LLC. an SEC Registered Investment Adviser.