
2016 Year in Review
Looking back at the market and economy during 2016, one word comes to mind—resilience! Despite numerous surprises and negative headlines, the equity markets could not be held back. The year 2016 can also serve as a reminder that no one can predict the future, especially when it comes to the direction of the markets, nor the outcome of elections for that matter. Of course, the year will most likely be remembered for the surprise election of Donald Trump as the 45th president of the United States, and also the Brexit vote.
If you recall, the equity markets started the year off dramatically as the S&P 500 declined 4.9% in the first 4 trading days of the year, the worst start to any year in history. Oil prices were in a steep decline, and the Chinese stock market was plummeting. On a daily basis, you could find talking heads on TV recommending to “sell everything”, calling for a US recession and an all-out market crash. The momentum fed on itself and by February 11th, the doomsday predictions seemed to be coming true with the S&P 500 down 10.50% from the start of the year.
At the time, we at Premier Wealth Advisors strongly believed there was a disconnect between market activity and economic fundamentals. Trading seemed irrational, as it was mostly driven by fear and emotion, often dictated by short term traders and further fueled by the financial media. It was our belief that economic fundamentals and long term value were being ignored. As a result, we held firm with our investment strategies, and for many of our clients, took advantage of opportunities to better position their portfolios. Over the years, we have witnessed similar activity and have learned that when markets are driven by emotion, there are often overreactions which create opportunities for longer-term investors. The markets quickly recovered, and the S&P 500 turned positive by March 17th. In fact, oil, commodities, and most markets around the world recovered—and rallied strongly—despite the unexpected shock of Great Britain’s decision to exit the European Union (Brexit).
2016 also saw the Fed raise interest rates for the first time since last December, noting that the labor market has continued to strengthen and that economic activity has been expanding at a moderate pace since midyear. Last but not least, “the Trump Bump”. Following the results of the presidential election, the equity indices surged to new highs. It’s important to note, however, that the majority of the rally was at the expense of the bond market and many of the equity markets’ previous winners. A rotation took place, and money flowed into the sectors and industries that may possibly benefit from Trump’s economic initiatives, such as increased infrastructure spending and reduced regulation. Whether this trend continues in 2017 remains to be seen.
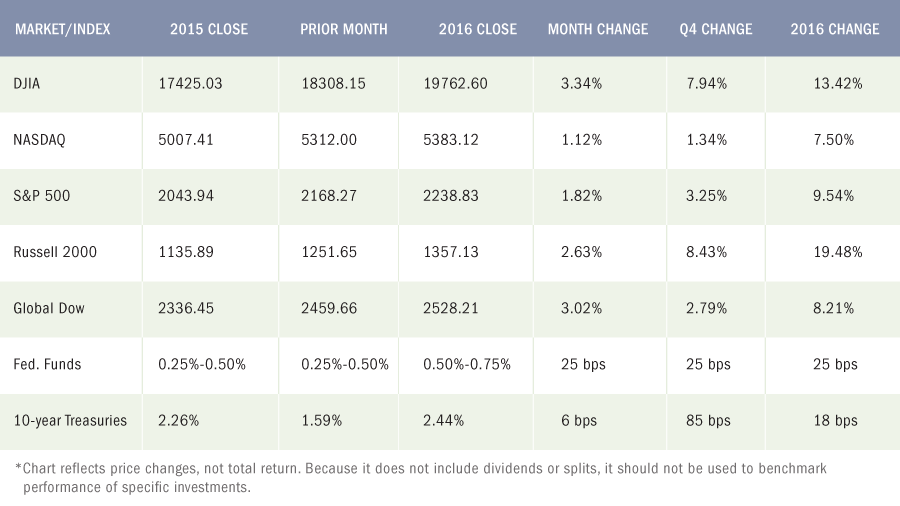
Dow 20,000. As markets hit record highs in the closing weeks of the year, the Dow began to flirt with the 20,000 mark for the first time in history. While Dow 20,000 is a fine round number with a lot of zeros, it’s primarily a psychological milestone with actual little meaning for investors.
Looking back at the market and economy during 2016, one word comes to mind—resilience! Despite numerous surprises and negative headlines, the equity markets could not be held back.
John L Diaz, CFP® / President & Senior Wealth Strategist
Equities
The year didn’t start off well for equities, but by the end of
Bonds
Volatility best describes the long-term bond market for 2016. Yields on 10-year Treasuries rose for the second straight year as prices fell. The yield on the benchmark 10-year Treasury note closed at 2.44%, up from its 2.26% yield at the close of 2015. During the early part of the year, bond prices rose as yields sunk below 1.40%. However, as investors saw a strengthening economy, higher inflation, and rising interest rates, a period of bond sales occurred, which peaked during the last quarter when the Treasury yield gained almost 0.85 percentage point, marking the largest quarterly gain since 1994.
Oil
As oil-producing countries flooded the market, oil prices fell below $30 per barrel during the first quarter. However, by the end of the year, crude oil prices had achieved their biggest annual gain since 2008. With OPEC pledging to cut production, oil prices surged to almost $60 per barrel, finally settling at $53.89 (WTI) per barrel on December 30.
Currencies
The dollar remained strong throughout the year, affecting imports and exports in the process. Falling oil prices, coupled with the expectation of higher interest rates, helped boost the U.S. dollar, which continued to rise over the course of the year. The U.S. Dollar Index, a measure of the dollar relative to the currencies of most U.S. major trading partners, gained about 3.67% over last year’s closing value. The dollar also benefitted from interest rates abroad, some of which were even lower than those for Treasuries. Tightening trade restrictions proposed by President-elect Trump may curtail continued growth of the dollar in 2017.
Gold
Gold rose over 8.5% on the year, closing 2016 at $1,152.00. Much of the gain was seen during the first half of the year, as the price fell following a lengthy period of sell-offs. Gold prices dropped seven of the last eight weeks as the stock market surged.
Employment
Improvement in the U.S. job market was slow but steady, with employment growth averaging 180,000 new jobs per month in 2016, compared with an average monthly increase of 229,000 new jobs in 2015. The unemployment rate ended the year (as of November 2016) at 4.6%, lower than the 5.0% rate at the close of 2015. According to the Bureau of Labor Statistics, there were 7.4 million unemployed persons in November 2016, down from 7.9 million unemployed in November 2015. The employment participation rate remained relatively the same — 62.7% in 2016 compared to 62.5% at the end of 2015. The employment to population ratio also remained relatively unchanged (59.7% in 2016 to 59.4% in 2015). In 2016, the average workweek was 34.4 hours. Average hourly earnings in 2016 increased $0.62 to $25.89 — a 2.5% gain over 2015.
GDP
The economy maintained a roughly 2.0% average growth rate through the third quarter of 2016. Economic growth has maintained this pace since 2009. The first-quarter GDP rose 0.8%, followed by a 1.4% gain in the second quarter and a 3.5% increase in the third quarter. Personal consumption expenditures, the value of consumer purchases for goods and services, increased an average of about 3.0% through the first three quarters of 2016. Gross domestic product measures the cost of production of U.S. goods and services. Gross domestic income, which is a measure of all income earned from the production of goods and services, rose 4.8% in the third quarter of 2016, compared to a 2.5% increase in the third quarter of 2015.
Inflation / Consumer spending
Based on the growth of consumer income, spending, and inflation, the economy for 2016 may be described as stable at best. Inflation remained below the Fed’s stated target rate of 2.0%, but indications are that it is expanding, albeit at a deliberate pace. Personal income through November increased 3.5% compared to November 2015. After-tax income (disposable personal income) over the same 12-month period rose 3.7%. Consumer spending, as measured by personal consumption expenditures, climbed 4.2% from November 2015. The personal consumption price index, an inflationary gauge relied on by the Fed, rose 1.4% year-over-year, while core PCE (PCE less volatile food and energy prices) increased 1.6%. The prices consumers pay for goods and services saw a moderate 1.7% increase from last November.
Housing
The housing market had been relatively strong for much of the year. Through November, existing home sales are up 15.4% over a year ago. The November annual sales rate of 5.61 million is the highest since February 2007. The median existing-home price for all housing types in November was $234,900, up 6.8% from November 2015 ($220,000). November’s price increase marks the 57th consecutive month of year-over-year gains. Total housing inventory was 1.85 million existing homes for sale — 9.3% lower than last November. Coupled with a shortage of rental units, home prices and rents are outpacing income in much of the country, according to the National Association of Realtors®. New home sales jumped 16.5% above the November 2015 estimate of 508,000 annual
Manufacturing
Manufacturing and industrial production were not consistently strong sectors this year. The Federal Reserve’s index of industrial production revealed that total industrial production in November was 0.6% lower than its year-earlier level. Overall industrial capacity utilization, a measure of efficiency, decreased 0.4 percentage point in November to 75.0%, a rate that is 5.0 percentage points below its long-run average. Capacity utilization for manufacturing was 74.8%, a rate that is 3.7 percentage points below its long-run average, which contributed to the decline in overall industrial capacity utilization. Evidencing stagnant manufacturing activity, new orders for manufactured durable goods (expected to last at least three years) declined 0.3% year-over-year, while shipments fell 0.8%. Capital goods — tangible assets used by manufacturers to produce consumer goods — also fell back as shipments decreased by 4.5% and new orders dropped 3.2% from last year.
Imports and exports
For the year, the goods and services trade deficit decreased by $8.8 billion, or 2.1%, from the same period in 2015. Exports decreased $58.7 billion, or 3.1%. Imports decreased $67.5 billion, or 2.9%. The strength of the dollar directly affected both import and export prices. Import prices fell 0.1% while export prices dropped 0.3% over the 12 months ended November 2016.
International markets
The big news on the international front was the United Kingdom’s referendum vote at the end of June to exit (“Brexit”) the European Union. After the vote was announced, Prime Minister David Cameron, an opponent of the push to leave the EU, resigned, with Theresa May becoming prime minister. Domestically, equities took an immediate hit following news of the vote but recovered fairly quickly. The value of the pound remains near a 30-year low and Britain lost its AAA credit rating, increasing the cost of government borrowing. However, both the FTSE 100 and the FTSE 250 closed the year trading higher than before the referendum. Depending on negotiations, the UK is expected to leave the EU by the summer of 2019. In other parts of the world, China’s economic growth slowed during the year, but later stabilized following further government stimulus. Central banks in Japan and Europe continued lowering interest rates to negative values, intending to motivate more lending and investing.
Eye On The Year Ahead
As the year came to a close, the Fed raised interest rates based on some favorable economic news, particularly regarding the labor front and expanding economic activity. The Fed is expected to consider three more rate increases during 2017.
President-elect Trump wants a “Race Horse” Economy, not a continuation of the “Plow Horse” that we’ve had for the past several years. New economic policies promoted by President-elect Donald Trump during his first year in office will likely impact the economy and equities markets, both domestically and abroad. Out of all of his proposals, the one that should help the economy the most is corporate tax reform, in particular, a big cut in the tax rate on profits to 15% or 20% from 35% at present. If this actually happens, this could be a big boost to corporate earnings, and in turn, the equity markets.
Will stock prices, which rose dramatically in the weeks following the election, continue their bull run in 2017? Will oil prices reach $60 per barrel as OPEC attempts to curb production, and will they actually honor the recent agreement? Will the dollar
Wishing you and your family a very healthy, happy, peaceful and prosperous New Year. John L. Diaz, CFP
Key Dates / Data Releases
1/3: PMI Manufacturing Index, ISM Manufacturing Index
1/6: Employment situation, international trade
1/10: JOLTS
1/12: Treasury budget
1/13: Producer Price Index, retail sales
1/17: Consumer Price Index, industrial production
1/19: Housing starts
1/24: Existing home sales
1/26: International trade in goods, new home sales
1/27: Durable goods orders, GDP
1/30: Personal income and outlays
1 Google Finance, September 26, 2018
2 The Wall Street Journal, September 23, 2018, http://go.steadyinvestor.com/e/279272/ons-1537698598-mod-djem10point/3g69x/286188741
3 The Wall Street Journal, September 24, 2018, http://go.steadyinvestor.com/e/279272/ect-1537777015-mod-djem10point/3g69z/286188741
Data sources: Economic: Based on data from U.S. Bureau of Labor Statistics (unemployment, inflation); U.S. Department of Commerce (GDP, corporate profits, retail sales, housing); S&P/Case-Shiller 20-City Composite Index (home prices); Institute for Supply Management (manufacturing/services). Performance: Based on data reported in WSJ Market Data Center (indexes); U.S. Treasury (Treasury yields); U.S. Energy Information Administration/Bloomberg.com Market Data (oil spot price, WTI Cushing, OK); www.goldprice.org (spot gold/silver); Oanda/FX Street (currency exchange rates). All information is based on sources deemed reliable, but no warranty or guarantee is made as to its accuracy or completeness. Neither the information nor any opinion expressed herein constitutes a solicitation for the purchase or sale of any securities, and should not be relied on as financial advice. Past performance is no guarantee of future results. All investing involves risk, including the potential loss of principal, and there can be no guarantee that any investing strategy will be successful.
The Dow Jones Industrial Average (DJIA) is a price-weighted index composed of 30 widely traded blue-chip U.S. common stocks. The S&P 500 is a market-cap weighted index composed of the common stocks of 500 leading companies in leading industries of the U.S. economy. The NASDAQ Composite Index is a market-value weighted index of all common stocks listed on the NASDAQ stock exchange. The Russell 2000 is a market-cap weighted index composed of 2,000 U.S. small-cap common stocks. The Global Dow is an equally weighted index of 150 widely traded blue-chip common stocks worldwide. Market indices listed are unmanaged and are not available for direct investment.
All third-party materials are the responsibility of their respective authors, creators, and/or owners. First Allied is not responsible for third-party materials, and the information reflects the opinion of its authors, creators, and/or owners at the time of its issuance, which opinions and information are subject to change at any time without notice and without obligation of notification.
These materials were obtained from sources believed to be reliable and presented in good faith, nevertheless, First Allied has not independently verified the information contained therein, and does not guarantee its accuracy or completeness.
The information has no regard to the specific investment objectives, financial situation, or particular needs of any specific recipient, and is intended for informational purposes only and does not constitute a recommendation, or an offer, to buy or sell any securities or related financial instruments, nor is it intended to provide tax, legal or investment advice. We recommend that you procure financial and/or tax advice as to the implications (including tax) of investing in any of the companies mentioned.
Securities offered
Advisory Services offered
This communication is strictly intended for individuals residing in the state(s) of AZ, CA, CT, DC, FL, GA, IL, MD, MA, NJ, NY, NC, PA, SC
PREMIER WEALTH ADVISORS
NEW YORK
1411 Broadway, 16th Floor
New York, NY 10018
(800) 499-4143
LONG ISLAND
626 RXR Plaza, 6th Floor
Uniondale, NY 11856
(516) 778-5822
All content on the Premier Wealth Advisors, LLC. websites are provided for informational purposes only and are deemed to be from reliable sources. However, no warranty, expressed or implied, is made regarding its presentation.
This content should not be viewed as a recommendation, offer, or solicitation by PWA to buy, sell, or hold any security or financial product, nor does it endorse any specific investment strategy. Past performance does not guarantee future results, and all investments carry the potential for loss.
PWA manages portfolios based on each client’s specific investment needs, as specified in a signed investment advisory agreement. As a result, each client’s portfolio reflects unique circumstances and investment outcomes. PWA’s outlook and strategies may change based on updated client information, or if material or significant shifts in economic and financial market conditions occur.
While PWA aims to add value in areas beyond investments, such as tax and estate planning, we do not claim to be income tax professionals or estate planning attorneys. You should consult your tax advisor and/or estate planning attorney for legal or accounting needs.
Advisory Services are offered through Premier Wealth Advisors, LLC. an SEC Registered Investment Adviser.