
2017 First Quarter Perspective
Riding the momentum following the presidential election, stocks surged for much of the first quarter of 2017. Buoyed by the anticipation of tax cuts and policies favorable to domestic businesses, the benchmark indexes listed here reached historic highs throughout the quarter. At the end of January, the Dow reached the magic 20000 mark for the first time, while the tech-heavy Nasdaq gained almost 4.50% for the month. The trend continued in February, as stocks posted solid monthly gains. The Dow closed the month with a run of 12 consecutive daily closings that reached all-time highs. The S&P 500 also achieved a milestone — 50 consecutive trading sessions without a daily swing of more than 1.0%. At the close of trading in February, each of the benchmark indexes listed here posted year-to-date gains, led by the Nasdaq, which was up over 8.0%.
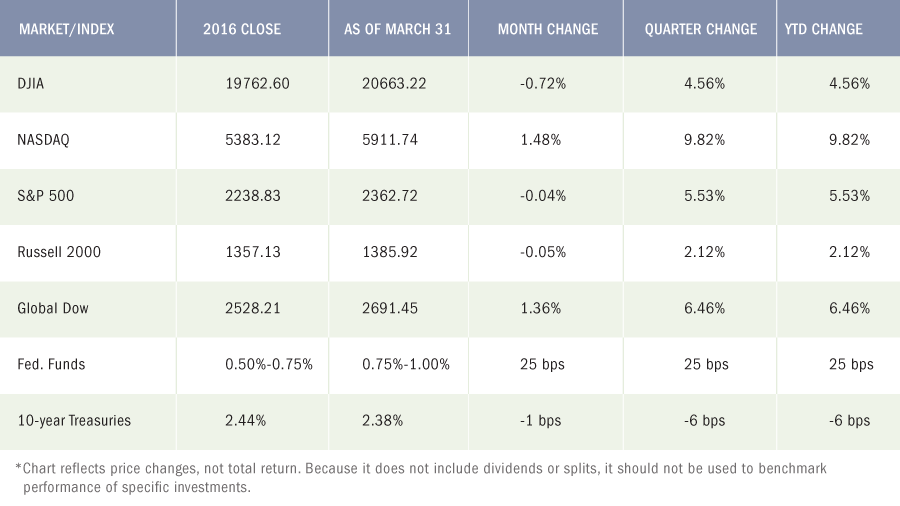
March began with a bang but ended with a whimper. The Dow closed the first week of the month at over 21000, while the Nasdaq gained over 9.0% year-to-date. However, energy stocks slipped as the price of oil began to fall. Entering mid-March, investors exercised caution pending the potential Fed interest rate hike and the push for a new health-care law. Following its mid-March meeting, the Fed raised interest rates 25 basis points, while the move to replace the ACA with a new health-care law failed for lack of congressional support.
For the quarter, each of the indexes listed here posted impressive gains over their fourth-quarter closing values. The Nasdaq climbed the most, posting quarterly gains of close to 10.0%, followed by the Global Dow and the S&P 500, which achieved its largest quarterly gain in almost two years. Long-term bond prices increased in the first quarter with the yield on 10-year Treasuries falling 6 basis points. Gold prices also climbed during the first three months of the year, closing the quarter at $1,251.60 — about 8.5% higher than its price at the end of the fourth quarter.
Riding the momentum following the presidential election, stocks surged for much of the first quarter of 2017.
John L Diaz, CFP® / President & Senior Wealth Strategist
Our Thoughts on the Current Economic & Market Environment
US Equity Markets
With a rebound in inflation expectations and a synchronized pick-up in economic indicators, investors may want to embrace the moment but at the same time, rethink their investment stance and review their allocation. While we believe the equity markets have priced in a lot of good news, there appears to be plenty of buyers who haven’t participated. What this means is that any substantial market selloff has been met with buyers looking to take advantage of lower equity prices. Barring any unforeseen major event, this trend may continue. However, while we don’t believe it is time to just blankly sell equities, we also don’t want to be complacent and we are therefore taking a cautious approach, with an eye towards hedging and protecting our client assets.
International Markets
With global growth expectations on the rise, we see room for more upside surprises in the ongoing global recovery that is continuing to improve corporate earnings abroad. The strong prospects for earnings growth, combined with reasonable valuations overseas, makes international equities appealing to us. Think “Global”!
Fixed Income
The FOMC next meets during the first week of May, when it will consider another interest rate hike. If employment remains strong and consumer prices trend higher, the Fed may raise the target range rate to 1.25% following their next meeting, with at least one more rate increase likely before the end of the year. While we see a low probability of a sharp and sustained surge in yields, our outlook for bonds is less optimistic. Fixed income assets are likely to be challenged amid broadly rising interest rates. We believe
As always, we at Premier Wealth Advisors are here to assist you and answer any questions you may have.
Monthly Economic News
Employment
February’s employment report showed continued strengthening in the labor sector with 235,000 new jobs added in the month, on the heels of 238,000 new jobs added in January. Job gains occurred in construction, private educational services, manufacturing, health care, and mining. The unemployment rate dipped to 4.7% — down from 4.9% a year earlier. There were 7.5 million unemployed persons in February. The labor participation rate inched up 0.1 percentage point to 63.0%. The average workweek was unchanged at 34.4 hours in February. Average hourly earnings increased by $0.06 to $26.09, following a $0.05 increase in January. Over the last 12 months ended in February, average hourly earnings have risen by $0.71, or 2.8%.
FOMC / interest rates
Following its meeting in March, the Federal Open Market Committee raised the target range for the federal funds rate by 25 basis points to 0.75%-1.00%. This is the first interest rate change for 2017, although the FOMC projects that it will increase rates two more times this year. The Committee expects that economic activity will expand at a moderate pace, labor market conditions will strengthen somewhat further, and inflation will stabilize around 2% over the medium term. FOMC Chair Janet Yellen supported the current rate hike, cautioning that without gradual rate increases inflation could escalate, requiring the Committee to raise rates rapidly which, in turn, could risk disrupting financial markets and push the economy into recession.
Oil
The price of crude oil (WTI) closed March at $50.85 per barrel, after spending much of the month hovering around $48.00 per barrel. The national average retail regular gasoline price was $2.314 per gallon on February 27, 2017, $0.018 higher than the January 30 price and $0.531 more than a year ago.
GDP / budget
Expansion of the U.S. economy slowed over the final three months of 2016. According to the Bureau of Economic Analysis, the fourth-quarter 2016 gross domestic product grew at an annualized rate of 2.1% compared to the third-quarter GDP, which grew at an annual rate of 3.5%. Growth in the GDP was slowed by downturns in exports, federal government spending, and business investment. A positive from the report is the rise in consumer spending, which increased 3.5% over the prior quarter. An indicator of inflationary trends, the price index for gross domestic purchases increased by 2.0% in the fourth quarter, compared to an increase of 1.5% in the third quarter. As to the government’s budget, the federal deficit for February was $192 billion. Over the first 5 months of the fiscal year, the deficit sits at $385 billion, which is 0.7% below the same period of time last year.
Inflation / Consumer Spending
Inflation, as measured by personal consumption expenditures, reached the Fed’s 2.0% annual target in February. For the 12 months ended in February 2017, personal consumption expenditures expanded at a rate of 2.1%. Core PCE (excluding energy and food) increased 1.8%. For February, PCE climbed 0.1%, while core PCE rose 0.2%, following a 0.3% monthly increase in January. Personal income (pre-tax earnings) rose 0.4% for the month, and disposable personal income (income
The prices companies receive for goods and services trended higher in February as the Producer Price Index climbed 0.3% for the month. Year-over-year, producer prices have increased by 2.2%. Energy prices have played a large part in the upward movement of the PPI, climbing 0.6% in February. The PPI less food and energy has risen 1.5% for the year, after climbing 0.3% in February.
Consumer prices also increased marginally in February, climbing 0.1%. However, consumer prices are up 2.7% for the year, a mark that is not only well above the Fed’s 2.0% target for inflation but stands as the highest rate of growth in almost five years. Even the core rate, which excludes energy, is holding steady at 2.2% since February 2016.
Housing
The housing sector proved to be a mixed bag in February as the sales pace of existing homes slowed while new home sales increased. Higher home prices and a lack of available homes for sale are the main reasons for the drop in the sales of existing homes, which fell 3.7% to a seasonally adjusted annual rate of 5.48 million, down from January’s revised annual rate of 5.69 million, according to the National Association of Realtors®. However, February’s sales pace is still 5.4% above a year ago. The median sales price for existing homes was $228,400 — up 7.7% from January. Total housing inventory at the end of February increased 4.2% to 1.75 million existing homes available for sale, but is 6.4% lower than a year ago (1.87 million) and has declined year-over-year for 21 straight months. Conversely, the Census Bureau’s latest report reveals a spike in new home sales. Sales of new single-family homes increased by 6.1% in February to an annual rate of 592,000 — up from January’s rate of 558,000. The median sales price of new houses sold in February was $296,200, while the average sales price was $390,400. The seasonally adjusted estimate of new houses for sale at the end of February was 266,000. This represents a supply of 5.4 months at the current sales rate, which is up from 262,000 homes available (supply of 5.4 months) in January.
Manufacturing
One of the reasons the Fed raised interest rates in March is the increase in manufacturing production. The Federal Reserve’s monthly index of industrial production (which includes factories, mines, and utilities) remained at the same level in February as the prior month, held down by another weak month for utilities. Unseasonably warm weather prompted utility production to fall 5.7% in February following a 5.8% drop in January. However, manufacturing production increased by 0.5% month-over-month, which is the largest increase in monthly volumes since July 2015. At 104.7% of its 2012 average, total industrial production in February was 0.3% above its level of a year earlier. Capacity utilization for the industrial sector declined 0.1 percentage point in February to 75.4%. As for durable goods, the latest report from the Census Bureau shows new orders increased 1.7% in February from the prior month. Excluding the volatile transportation segment, new durable goods orders gained a lackluster 0.4%. Orders for core capital goods (excluding defense and transportation) dropped 0.1% for the month, but are up 2.7% over February 2016.
Imports and exports
The advance report on international trade in goods revealed that the trade gap narrowed by 5.9% in February. The overall trade deficit was $64.8 billion in February, down $4.1 billion from January. Exports declined 0.1% to $126.8 billion, $0.1 billion less than January exports. Imports fell 2.1% to $191.6 billion, $4.2 billion less than January imports. The prices for U.S. imports of goods advanced 0.2% in February, led by higher nonfuel import prices, which more than offset lower fuel prices. U.S. export prices rose 0.3% in February, after advancing 0.2% in January. Export prices haven’t recorded a monthly decline since the index fell 0.8% in August 2016.
International markets
A relatively positive stream of eurozone economic data helped international stocks post gains for February. Both manufacturing and service sectors accelerated during the month, while eurozone job creation reached a 10-year high. In Great Britain, Prime Minister May continued to push forward with Brexit amid pushback from Parliament and protestors. Nevertheless, the UK delivered written notice to the president of the European Union, formally beginning the process of leaving the EU. This action now opens a two-year window for Britain to negotiate the terms of its exit. One of the potentially contentious issues that will be addressed is whether, and how much, Britain will pay to leave the bloc. In Japan, retail sales increased 1.0% for the month, although the fourth-quarter GDP growth slowed from the previous quarter.
Consumer sentiment
The Conference Board Consumer Confidence Index® for February rose 3.2 points to 114.8. Consumers expressed confidence in the job market, which increased expectations for the economy in general. The Surveys of Consumers of the University of Michigan Index of Consumer Sentiment dipped from a 10-year high of 98.5 in January to 96.3 in February. Nevertheless, consumers continued to express optimism about current economic conditions, as the Current Conditions Index has been trending upward since December 2016.
Key Dates / Data Releases
4/3: PMI Manufacturing Index, ISM Manufacturing Index
4/4: International trade
4/7: Employment situation
4/11: JOLTS
4/12: Treasury budget
4/13: Producer Price Index
4/14: Consumer Price Index, retail sales
4/18: Industrial production, housing starts
4/21: Existing home sales
4/25: New home sales
4/27: International trade in goods, durable goods orders
4/28: GDP
Data sources: Economic: Based on data from U.S. Bureau of Labor Statistics (unemployment, inflation); U.S. Department of Commerce (GDP, corporate profits, retail sales, housing); S&P/Case-Shiller 20-City Composite Index (home prices); Institute for Supply Management (manufacturing/services). Performance: Based on data reported in WSJ Market Data Center (indexes); U.S. Treasury (Treasury yields); U.S. Energy Information Administration/Bloomberg.com Market Data (oil spot price, WTI Cushing, OK); www.goldprice.org (spot gold/silver); Oanda/FX Street (currency exchange rates). All information is based on sources deemed reliable, but no warranty or guarantee is made as to its accuracy or completeness. Neither the information nor any opinion expressed herein constitutes a solicitation for the purchase or sale of any securities, and should not be relied on as financial advice. Past performance is no guarantee of future results. All investing involves risk, including the potential loss of principal, and there can be no guarantee that any investing strategy will be successful.
The Dow Jones Industrial Average (DJIA) is a price-weighted index composed of 30 widely traded blue-chip U.S. common stocks. The S&P 500 is a market-cap weighted index composed of the common stocks of 500 leading companies in leading industries of the U.S. economy. The NASDAQ Composite Index is a market-value weighted index of all common stocks listed on the NASDAQ stock exchange. The Russell 2000 is a market-cap weighted index composed of 2,000 U.S. small-cap common stocks. The Global Dow is an equally weighted index of 150 widely traded blue-chip common stocks worldwide. Market indices listed are unmanaged and are not available for direct investment.
All third-party materials are the responsibility of their respective authors, creators, and/or owners. First Allied is not responsible for third-party materials, and the information reflects the opinion of its authors, creators, and/or owners at the time of its issuance, which opinions and information are subject to change at any time without notice and without obligation of notification.
These materials were obtained from sources believed to be reliable and presented in good faith, nevertheless, First Allied has not independently verified the information contained therein, and does not guarantee its accuracy or completeness.
The information has no regard to the specific investment objectives, financial situation, or particular needs of any specific recipient, and is intended for informational purposes only and does not constitute a recommendation, or an offer, to buy or sell any securities or related financial instruments, nor is it intended to provide tax, legal or investment advice. We recommend that you procure financial and/or tax advice as to the implications (including tax) of investing in any of the companies mentioned.
PREMIER WEALTH ADVISORS
NEW YORK
1411 Broadway, 16th Floor
New York, NY 10018
(800) 499-4143
LONG ISLAND
626 RXR Plaza, 6th Floor
Uniondale, NY 11856
(516) 778-5822
All content on the Premier Wealth Advisors, LLC. websites are provided for informational purposes only and are deemed to be from reliable sources. However, no warranty, expressed or implied, is made regarding its presentation.
This content should not be viewed as a recommendation, offer, or solicitation by PWA to buy, sell, or hold any security or financial product, nor does it endorse any specific investment strategy. Past performance does not guarantee future results, and all investments carry the potential for loss.
PWA manages portfolios based on each client’s specific investment needs, as specified in a signed investment advisory agreement. As a result, each client’s portfolio reflects unique circumstances and investment outcomes. PWA’s outlook and strategies may change based on updated client information, or if material or significant shifts in economic and financial market conditions occur.
While PWA aims to add value in areas beyond investments, such as tax and estate planning, we do not claim to be income tax professionals or estate planning attorneys. You should consult your tax advisor and/or estate planning attorney for legal or accounting needs.
Advisory Services are offered through Premier Wealth Advisors, LLC. an SEC Registered Investment Adviser.