
2017 Fourth Quarter Perspective
As we approach the end of 2017, it’s hard to believe that given the uncertain and volatile way the year began, the S&P 500 is now on track for its ninth consecutive positive year. This would make this bull market as long as the historic bull market run of the 1990s. With the market this far along, many of our clients are wondering just how much longer this can last, followed by, how do we participate and of course, is it time to sell or change our strategy?
Even though valuations are arguably stretched by historical standards, economic fundamentals still do support higher equity prices. Despite the devastation from hurricanes and natural disasters, third quarter real GDP growth came in at a healthy 3.0% rate. Looking at the 4th Quarter, early signs are suggesting GDP growth is continuing and possibly improving on that growth rate. When you couple that with corporate earnings reports that are trending ahead of estimates, employment still robust and interest rates still at historically low levels, equity investors still have a lot to be positive about.
Regardless of the generally positive fundamental picture, I want to emphasize the importance for every investor to understand their portfolio strategy and make sure that it is in sync with their investment time frame, their liquidity needs, and their tolerance for volatility and risk. The answers to those key questions should be the main factors in determining how much of your investment allocation should be allocated to equities. It is human nature that during time likes these, investors get too complacent and drift from their investment disciplines, causing them to take on more risk than they really should. We at Premier Wealth Advisors help our clients evaluate their portfolios to keep them on track. We are here to help, speak with us!
With the market this far along, many of our clients are wondering just how much longer this can last, followed by, how do we participate and of course, is it time to change our strategy?
John L. Diaz, CFP® / President & Senior Wealth Strategist
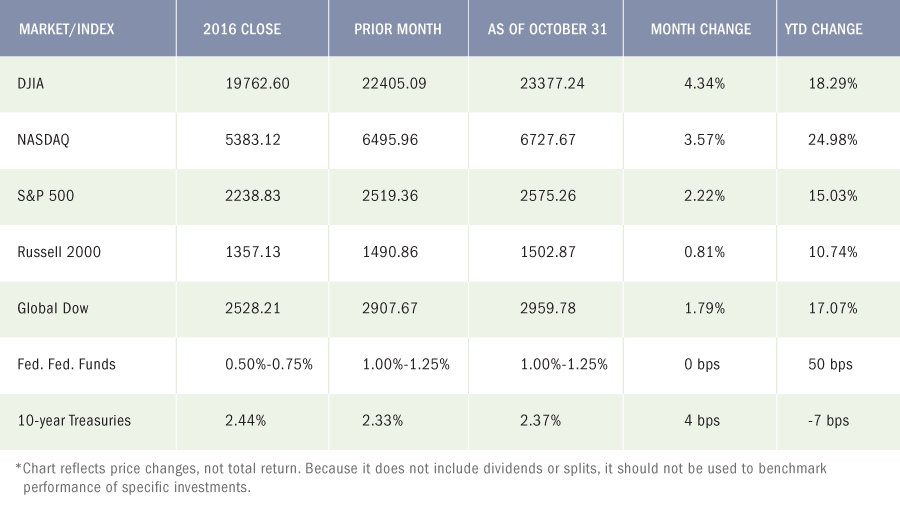
The Markets(as of market close Oct. 31, 2017)
Despite the continuing drama in the White House and the fury of Mother Nature, stock growth remained steady for much of October. Favorable corporate earnings reports, a strong jobs sector, and growing consumer income overcame any trepidations investors may have had. Each of the benchmark indexes listed below posted monthly gains, led by the large caps of the Dow, which gained over 4% for the month and is up over 18% year-to-date. The tech-heavy Nasdaq has remained steady throughout the year, reaching new highs in October. The small caps of the Russell 2000 gained less than 1.0% for the month but is up over 10.0% since the end of 2016.
By the close of trading on October 31, the price of crude oil (WTI) was $54.54 per barrel, up from the September 29 price of $47.07 per barrel. The national average retail regular gasoline price was $2.488 per gallon on October 30, down from the September 25 selling price of $2.583 and $0.258 more than a year ago. The price of gold increased by the end of October, closing at $1,271.80 on the last trading day of the month, down $18.04 from its September 29 price of $1,289.84.
October Economic News
Employment
September saw a loss of 33,000 jobs after averaging 172,000 new jobs over the prior 12 months. The unemployment rate fell slightly to 4.2%. The number of unemployed persons declined by 331,000 to 6.8 million. The labor participation rate increased from 62.9% in August to 63.1%. The average workweek for all employees remained at 34.4 hours in September. Average hourly earnings rose by $0.12 to $26.55. Over the 12 months ended in September, average hourly earnings have risen $0.74, or 2.9%. According to the Bureau of Labor Statistics, hurricanes Harvey and Irma impacted the number of jobs available, but not the national unemployment rate. This report appears to indicate that the labor market is tightening with fewer jobs available and increasing wages needed to attract workers.
FOMC / interest rates
The Federal Open Market Committee met in September following its last meeting in July and left the target federal funds rate range at 1.00%-1.25%. However, some economic indicators are showing mild inflationary pressures, which, when coupled with a labor market that could be nearing full employment, may lead to another interest rate hike when the Committee next meets in early November.
GDP / budget
The first estimate of the third-quarter gross domestic product showed expansion at an annual rate of 3.0%, according to the Bureau of Economic Analysis. The second-quarter GDP grew at an annualized rate of 3.1%. Gross domestic income, which estimates all income earned while producing goods and services, increased 1.8% in the third quarter compared to an increase of 0.9% in the second quarter. As to the government’s budget, September marked the end of the fiscal year. The federal deficit for FY 2017 was $665.7 billion, more than $80 billion, or 13.7%, higher than the 2016 deficit. For the 2017 fiscal year, government expenses increased by about 3.0%, while receipts rose 1.5%.
Inflation / Consumer Spending
Inflationary pressures may be mounting. The personal consumption expenditures (PCE) price index (a measure of what consumers pay for goods and services) ticked up 0.4% in September after climbing only 0.2% in August. The core PCE price index (excluding energy and food) inched ahead 0.1% for the month. Personal (pre-tax) income increased 0.4% and disposable personal (after-tax) income also gained 0.4% from the prior month. Personal consumption expenditures (the value of the goods and services purchased by consumers) jumped a robust 1.0%.
According to the Consumer Price Index, consumer prices rose 0.5% in September, after recording a 0.4% gain in August. For the 12 months ended in September, consumer prices are up 2.2%, a mark that approaches the Fed’s 2.0% target for inflation. Core prices, which exclude food and energy, edged up 0.1% in September, and are up 1.7% since September 2016.
The Producer Price Index showed the prices companies receive for goods and services advanced 0.4% in September from August. Year-over-year, producer prices have increased by 2.6%. Prices less food and energy increased 0.4% for the month and are up 2.2% over the past 12 months.
Housing
The housing sector started to gain momentum heading into the fall season. Total existing-home sales climbed 0.7% for September following a 1.7% drop in August. Over the last 12 months, sales of existing homes are down 1.5%. The September median price for existing homes was $245,100, 3.4% lower than August’s median price of $253,500 but up 4.2% from the median price last September. Inventory for existing homes rose 1.6% for the month following an August decline of 2.1%. The Census Bureau’s latest report reveals sales of new single-family homes climbed a whopping 18.9% in September to an annual rate of 667,000 — far outpacing August’s rate of 561,000. The median sales price of new houses sold in September was $319,700 compared to $300,200 in August. The average sales price was $385,200 ($368,100 in August). The number of houses for sale at the end of September was 279,000 (284,000 in August), which represents a supply of 5.0 months at the current sales rate.
Manufacturing
Industrial production increased 0.3% in September following a 0.9% decline in August. The continued effects of Hurricane Harvey and, to a lesser degree, the effects of Hurricane Irma combined to hold down the growth in total production in September by 0.25 percentage point. Capacity utilization increased slightly from 75.8% in August to 76.0% in September. Manufacturing output edged up 0.1%. Mining output rose 0.4% in September after declining 0.8% in August. The index for utilities jumped 1.5% after falling 5.5% in August. New orders for manufactured durable goods increased 2.2% in September after climbing 1.7% in August. Shipments of manufactured goods increased 1.0%, while unfilled orders, which fell the prior two months, increased 0.2% in September.
Imports and exports
The advance report on international trade in goods revealed that the trade gap for September was $64.138 billion, $0.8 billion (or about 1.3%) greater than the deficit in August. Exports of goods for September were $129.6 billion, $0.9 billion more than August exports. Imports of goods for September were $193.7 billion, $1.7 billion more than August imports.
International markets
In a sign that the European economy is heading in the right direction, the European Central Bank is scaling back its bond-buying program, while extending its duration well into 2018. The ECB will continue to buy bonds into September of 2018, but at a slower pace. The province of Catalonia, Spain, held a controversial independence referendum on October 1, where voters were heavily in favor of splitting from Spain. The Spanish high court declared the referendum vote illegal. Nevertheless, Catalonia’s regional president signed a declaration of independence about a week later, which has since prompted the Spanish prime minister to consider imposition of direct rule. Experts have estimated that a Catalonian break from Spain, a Catalexit, could have a significant impact on the Spanish economy.
Consumer sentiment
Consumer confidence in the economy rose in October, reaching its highest level in almost 17 years. The Conference Board Consumer Confidence Index® for October climbed to 125.9 from September’s revised 120.6. Consumers expressed growing optimism about present economic conditions as well as future growth. A strong job market and improving business conditions were the primary reasons for the upbeat consumer sentiment.
The GOP Tax Proposal and how it could affect you!
- House Republicans have released their tax proposal and most likely, the plan may be quite different after the Senate puts their stamp on it in the coming days before legislation could be sent to President Trump for his signature. But for now, what big takeaways should you be focused on?
- The top tax rate stayed the same at 39.6%, however, it only applies to income over $1 million for a married couple which is more than twice the current level. That means those at the top level would have more than $500,000 of income taxed at 35% rather than 39.6%, a possible savings of about $25,000.
- Higher-income taxpayers would also get the benefit of the new lower tax rates on lower tiers of income. For example, income that is now taxed at 28% and 33% tax rates would be taxed at 25%. However, there does appear to be a clawback in place that would prevent high-income taxpayers from benefiting from the 12% bracket.
- The new lowest rate of 12% would replace the current 10%, so that would appear to be an increase on those at the lowest income levels, but the larger standard deduction and expanded child credits should address that potential increase. Essentially giving them a tax break from the current system.
- The estate tax exemption would double, with a plan to repeal the tax after six years. However, given that estate taxes are viewed as a tax only on the rich, it is likely that this may be changed during the final negotiations.
- There was a lot of talk of changes to retirement plan savings provisions like the 401k, however, they appear to be unchanged which is a positive for people to save for retirement. However, with lower marginal tax rates for most taxpayers, the current salary reduction tax benefit of those savings would be reduced – thus making Roth-style plans marginally more attractive.
- The plan is to repeal the Alternative Minimum Tax- AMT, but as the estate tax repeal the AMT is viewed as a tax on the highest-income earners, so it will most likely be used as a bargaining chip and the repeal may not make the final bill.
- The deduction for property taxes would be capped at $10,000, but the state income tax deduction would go away. These deductions are a big issue and will be strongly debated and therefore will most likely change.
- There are good incentives for businesses with a lower corporate tax rate and an immediate deduction for the cost of new equipment. The new rate would be 25%, but only on income that is not attributed to labor. For example, service firms like lawyers, accountants and consultants may not benefit from the lower rate.
Ten Year End Tax Tips for 2017
Here are 10 things to consider as you weigh potential tax moves between now and the end of the year.
1. Set aside time to plan
Effective planning requires that you have a good understanding of your current tax situation, as well as a reasonable estimate of how your circumstances might change next year. There’s a real opportunity for tax savings if you’ll be paying taxes at a lower rate in one year than in the other. However, the window for most tax-saving moves closes on December 31, so don’t procrastinate.
2. Defer income to next year
Consider opportunities to defer income to 2018, particularly if you think you may be in a lower tax bracket then. For example, you may be able to defer a year-end bonus or delay the collection of business debts, rents, and payments for services. Doing so may enable you to postpone payment of tax on the income until next year.
3. Accelerate deductions
You might also look for opportunities to accelerate deductions into the current tax year. If you itemize deductions, making payments for deductible expenses such as medical expenses, qualifying interest, and state taxes before the end of the year, instead of paying them in early 2018, could make a difference on your 2017 return.
4. Factor in the AMT
If you’re subject to the alternative minimum tax (AMT), traditional year-end maneuvers such as deferring income and accelerating deductions can have a negative effect. Essentially a separate federal income tax system with its own rates and rules, the AMT effectively disallows a number of itemized deductions. For example, if you’re subject to the AMT in 2017, prepaying 2018 state and local taxes probably won’t help your 2017 tax situation, but could hurt your 2018 bottom line. Taking the time to determine whether you may be subject to the AMT before you make any year-end moves could help save you from making a costly mistake.
5. Bump up withholding to cover a tax shortfall
If it looks as though you’re going to owe federal income tax for the year, especially if you think you may be subject to an estimated tax penalty, consider asking your employer (via Form W-4) to increase your withholding for the remainder of the year to cover the shortfall. The biggest advantage in doing so is that withholding is considered as having been paid evenly through the year instead of when the dollars are actually taken from your paycheck. This strategy can also be used to make up for low or missing quarterly estimated tax payments.
6. Maximize retirement savings
Deductible contributions to a traditional IRA and pre-tax contributions to an employer-sponsored retirement plan such as a 401(k) can reduce your 2017 taxable income. If you haven’t already contributed up to the maximum amount allowed, consider doing so by year-end.
7. Take any required distributions
Once you reach age 70½, you generally must start taking required minimum distributions (RMDs) from traditional IRAs and employer-sponsored retirement plans (an exception may apply if you’re still working for the employer sponsoring the plan). Take any distributions by the date required — the end of the year for most individuals. The penalty for failing to do so is substantial: 50% of any amount that you failed to distribute as required.
8. Weigh year-end investment moves
You shouldn’t let tax considerations drive your investment decisions. However, it’s worth considering the tax implications of any year-end investment moves that you make. For example, if you have realized net capital gains from selling securities at a profit, you might avoid being taxed on some or all of those gains by selling losing positions. Any losses over and above the amount of your gains can be used to offset up to $3,000 of ordinary income ($1,500 if your filing status is married filing separately) or carried forward to reduce your taxes in future years.
9. Beware the net investment income tax
Don’t forget to account for the 3.8% net investment income tax. This additional tax may apply to some or all of your net investment income if your modified AGI exceeds $200,000 ($250,000 if married filing jointly, $125,000 if married filing separately, $200,000 if a head of household).
10. Get help if you need it
There’s a lot to think about when it comes to tax planning. That’s why it often makes sense to talk to a tax professional who is able to evaluate your situation and help you determine if any year-end moves make sense for you.
Key Dates / Data Releases
11/1: FOMC meeting
11/3: Employment situation, international trade
11/7: JOLTS
11/10: Treasury budget
11/14: Producer Price Index
11/15: Consumer Price Index, retail sales
11/16: Industrial production, import and export prices
11/17: Housing starts
11/21: Existing home sales
11/22: Durable goods orders
11/27: New home sales
11/28: International trade
Data sources: Economic: Based on data from U.S. Bureau of Labor Statistics (unemployment, inflation); U.S. Department of Commerce (GDP, corporate profits, retail sales, housing); S&P/Case-Shiller 20-City Composite Index (home prices); Institute for Supply Management (manufacturing/services). Performance: Based on data reported in WSJ Market Data Center (indexes); U.S. Treasury (Treasury yields); U.S. Energy Information Administration/Bloomberg.com Market Data (oil spot price, WTI Cushing, OK); www.goldprice.org (spot gold/silver); Oanda/FX Street (currency exchange rates). All information is based on sources deemed reliable, but no warranty or guarantee is made as to its accuracy or completeness. Neither the information nor any opinion expressed herein constitutes a solicitation for the purchase or sale of any securities, and should not be relied on as financial advice. Past performance is no guarantee of future results. All investing involves risk, including the potential loss of principal, and there can be no guarantee that any investing strategy will be successful.
The Dow Jones Industrial Average (DJIA) is a price-weighted index composed of 30 widely traded blue-chip U.S. common stocks. The S&P 500 is a market-cap weighted index composed of the common stocks of 500 leading companies in leading industries of the U.S. economy. The NASDAQ Composite Index is a market-value weighted index of all common stocks listed on the NASDAQ stock exchange. The Russell 2000 is a market-cap weighted index composed of 2,000 U.S. small-cap common stocks. The Global Dow is an equally weighted index of 150 widely traded blue-chip common stocks worldwide. Market indices listed are unmanaged and are not available for direct investment.
All third-party materials are the responsibility of their respective authors, creators, and/or owners. First Allied is not responsible for third-party materials, and the information reflects the opinion of its authors, creators, and/or owners at the time of its issuance, which opinions and information are subject to change at any time without notice and without obligation of notification.
These materials were obtained from sources believed to be reliable and presented in good faith, nevertheless, First Allied has not independently verified the information contained therein, and does not guarantee its accuracy or completeness.
The information has no regard to the specific investment objectives, financial situation, or particular needs of any specific recipient, and is intended for informational purposes only and does not constitute a recommendation, or an offer, to buy or sell any securities or related financial instruments, nor is it intended to provide tax, legal or investment advice. We recommend that you procure financial and/or tax advice as to the implications (including tax) of investing in any of the companies mentioned.
PREMIER WEALTH ADVISORS
NEW YORK
1411 Broadway, 16th Floor
New York, NY 10018
(800) 499-4143
LONG ISLAND
626 RXR Plaza, 6th Floor
Uniondale, NY 11856
(516) 778-5822
All content on the Premier Wealth Advisors, LLC. websites are provided for informational purposes only and are deemed to be from reliable sources. However, no warranty, expressed or implied, is made regarding its presentation.
This content should not be viewed as a recommendation, offer, or solicitation by PWA to buy, sell, or hold any security or financial product, nor does it endorse any specific investment strategy. Past performance does not guarantee future results, and all investments carry the potential for loss.
PWA manages portfolios based on each client’s specific investment needs, as specified in a signed investment advisory agreement. As a result, each client’s portfolio reflects unique circumstances and investment outcomes. PWA’s outlook and strategies may change based on updated client information, or if material or significant shifts in economic and financial market conditions occur.
While PWA aims to add value in areas beyond investments, such as tax and estate planning, we do not claim to be income tax professionals or estate planning attorneys. You should consult your tax advisor and/or estate planning attorney for legal or accounting needs.
Advisory Services are offered through Premier Wealth Advisors, LLC. an SEC Registered Investment Adviser.